HelpDesk
How to Connect a Live Object to a Text Data Source

 HR Dashboard
The HR Dashboard solution extends ConceptDraw DIAGRAM functionality with powerful drawing tools and great collection of comprehensive vector design elements, icons, pictograms and objects, navigation elements, live objects of HR charts, HR indicators, and thematic maps. The range of HR Dashboards applications is extensive, among them the human resource management, recruitment, hiring process, human resource development. ConceptDraw DIAGRAM software is perfect for creation HR Dashboard with any goal you need. It gives you all opportunities for designing not only informative, but also professional looking and attractive HR Dashboards of any style and degree of detalization, that are perfect for using in presentations, reports and other thematic documents.
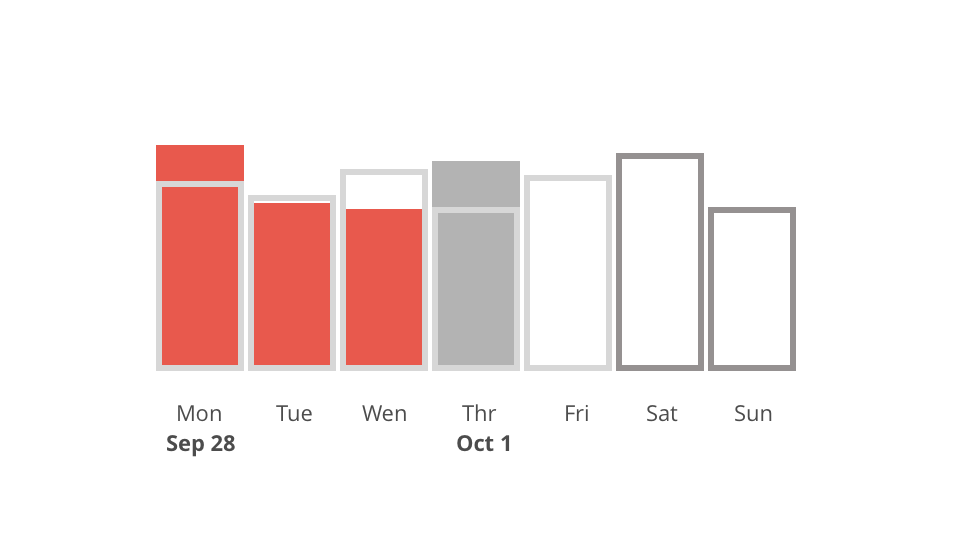
Dashboards. Time Scale. Part I
 iPhone User Interface
iPhone User Interface solution extends ConceptDraw DIAGRAM software with templates, samples and libraries with large quantity of vector stencils of graphical user interface elements, Apps icons, UI patterns for designing and prototyping of the iOS applic
 Scatter Diagrams
The Scatter Diagrams solution extends ConceptDraw DIAGRAM functionality with templates, samples, and a library of vector stencils that make construction of a Scatter Plot easy. The Scatter Chart Solution makes it easy to design attractive Scatter Diagrams used in various fields of science, work, and life activities. ConceptDraw DIAGRAM lets you enter the data to the table and construct the Scatter Plot Graph automatically according to these data.
 Android User Interface
The Android User Interface solution allows ConceptDraw DIAGRAM act as an Android UI design tool. Libraries and templates contain a variety of Android GUI elements to help users create images based on Android UI design.
 macOS User Interface
macOS User Interface solution extends the ConceptDraw DIAGRAM functionality with powerful GUI software graphic design features and tools. It provides an extensive range of multifarious macOS Sierra user interface design examples, samples and templates, and wide variety of libraries, containing a lot of pre-designed vector objects of Mac Apps icons, buttons, dialogs, menu bars, indicators, pointers, controls, toolbars, menus, and other elements for fast and simple designing high standard user interfaces of any complexity for new macOS Sierra.
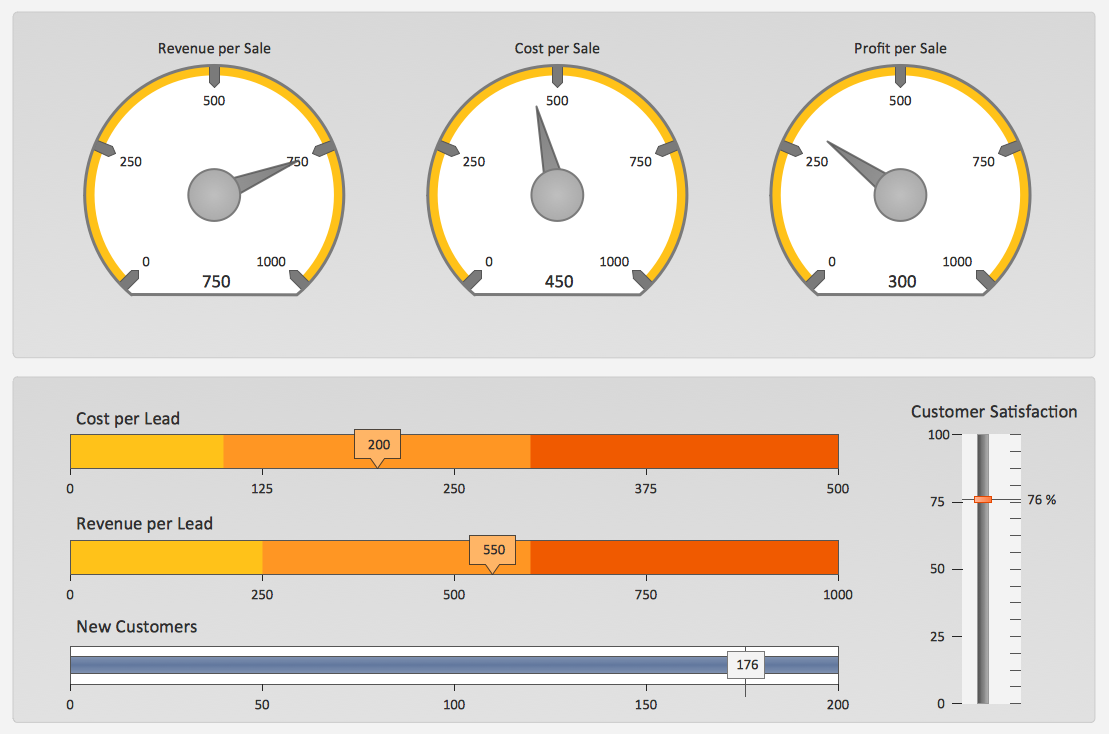
Sales Dashboard Screenshot
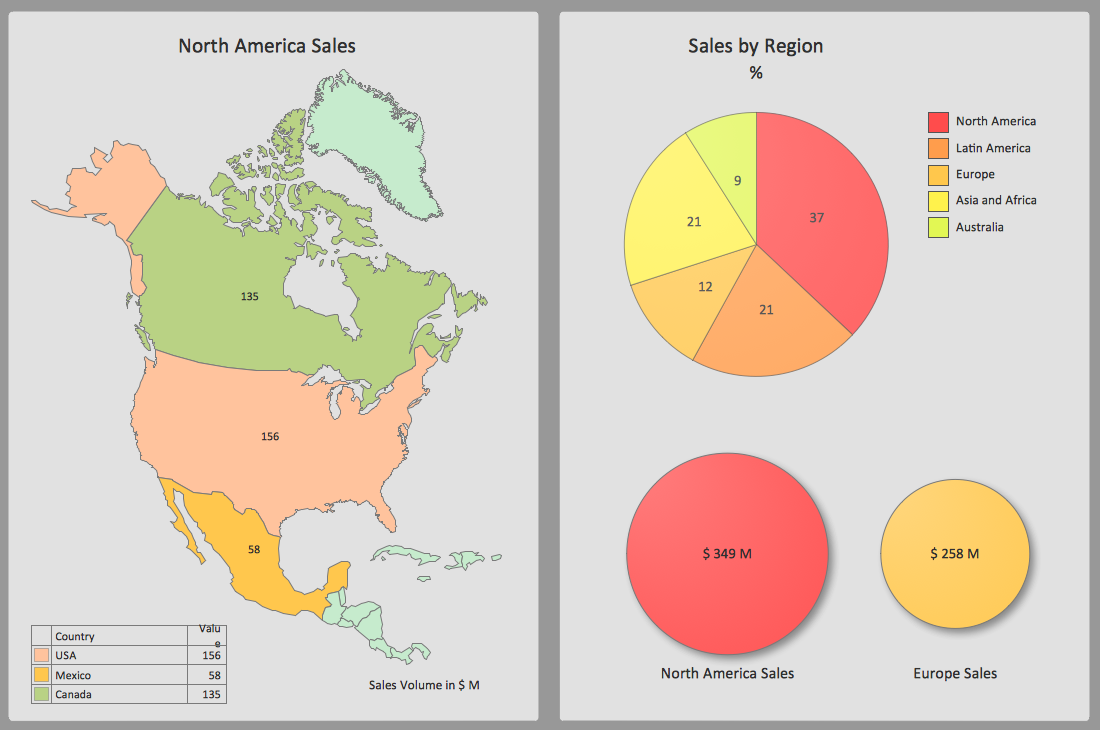
Sales KPI Dashboards
- Design elements - Meter indicators | Meter Dashboard | Meter ...
- Enterprise dashboard | How to Create an IDEF0 Diagram for an ...
- Status Dashboard | Projects HR dashboard | A KPI Dashboard ...
- Graphically Level Of Organization
- Sales metrics and KPIs - Visual dashboard | Sales KPIs ...
- Graphically The Level Of Organization
- Enterprise dashboard | KPI Dashboard | HR Flowcharts | Human ...
- Project task status dashboard
- Status Dashboard | Design elements - Status indicators | Status ...
- Process Flowchart | Graphical Symbols to use in EPC diagrams ...
- ERD | Entity Relationship Diagrams, ERD Software for Mac and Win
- Flowchart | Basic Flowchart Symbols and Meaning
- Flowchart | Flowchart Design - Symbols, Shapes, Stencils and Icons
- Flowchart | Flow Chart Symbols
- Electrical | Electrical Drawing - Wiring and Circuits Schematics
- Flowchart | Common Flowchart Symbols
- Flowchart | Common Flowchart Symbols