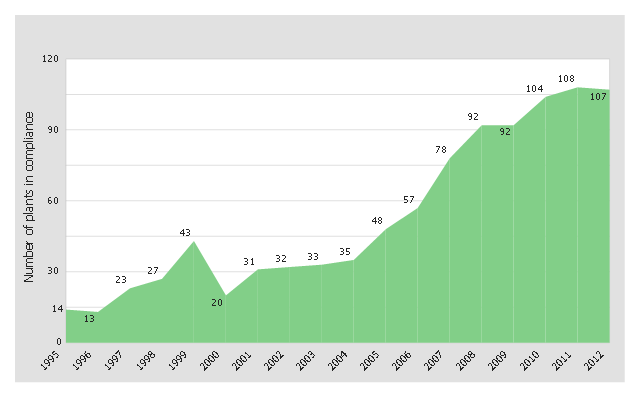
This area chart sample was redesigned from the picture "Outstanding trends of wastewater treatment plants" from the Washington State Department of Ecology website.
[ecy.wa.gov/ programs/ wq/ wastewater/ op_ cert/ kudos.html]
"Sewage treatment is the process of removing contaminants from wastewater and household sewage, both runoff (effluents), domestic, commercial and institutional. It includes physical, chemical, and biological processes to remove physical, chemical and biological contaminants. Its objective is to produce an environmentally safe fluid waste stream (or treated effluent) and a solid waste (or treated sludge) suitable for disposal or reuse (usually as farm fertilizer). Using advanced technology it is now possible to re-use sewage effluent for drinking water, although Singapore is the only country to implement such technology on a production scale in its production of NEWater." [Sewage treatment. Wikipedia]
The area graph example "Outstanding trends of wastewater treatment plants" was created using the ConceptDraw PRO diagramming and vector drawing software extended with the Area Charts solution from the Graphs and Charts area of ConceptDraw Solution Park.
Area chart
Line Graph

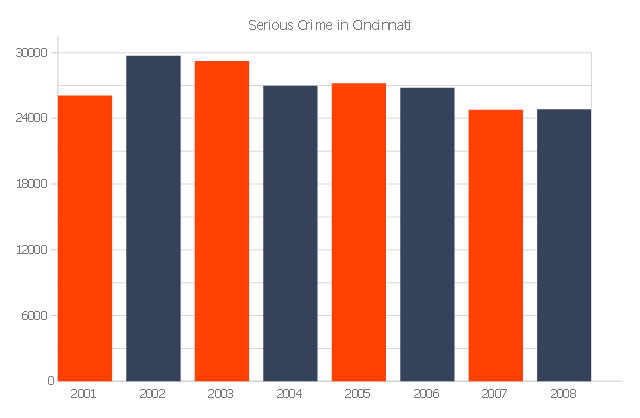
The vertical bar graph sample shows the serious crime number in Cincinnati from 2001 to 2008. It was designed on the base of the Commons Wikimedia file: Cincinnati-Part-1-Crimes.jpg.
[commons.wikimedia.org/ wiki/ File:Cincinnati-Part-1-Crimes.jpg]
"Before the riot of 2001, Cincinnati's overall crime rate was dropping dramatically and had reached its lowest point since 1992. After the riot violent crime increased. Reflecting national trends, crime rates in Cincinnati have dropped in all categories from 2006 to 2010." [Crime in Cincinnati. Wikipedia]
The column chart example "Serious crime in Cincinnati" was created using the ConceptDraw PRO diagramming and vector drawing software extended with the Bar Graphs solution from the Graphs and Charts area of ConceptDraw Solution Park.
Column graph
How to Draw a Line Graph

Bar Diagrams for Problem Solving. Create manufacturing and economics bar charts with Bar Graphs Solution

 Line Graphs
How to draw a Line Graph with ease? The Line Graphs solution extends the capabilities of ConceptDraw PRO v10 with professionally designed templates, samples, and a library of vector stencils for drawing perfect Line Graphs.
Line Chart Examples

This line graph sample shows the relative price changes for fresh fruits and vegetables, sugars and sweets, and soft drinks, using the period 1982–84 as the baseline (index = 100), 1978–2002. It was designed on the base of line chart from the website of the U.S. National Center for Chronic Disease Prevention and Health Promotion.
"The number of overweight and obese youth has increased in recent decades, yet few data assess how the lives of children have changed during the “obesity epidemic.” ...
Eating as a primary activity declined, suggesting a shift toward snacking or eating as a secondary activity. Statistically significant trends exist for carbohydrate intake, especially for chips/ crackers/ popcorn/ pretzels (intake tripled from the mid-1970s to the mid-1990s) and soft drinks (intake doubled during the same period). Price and income data suggest possible economic reasons for these changes. The percentage of disposable income spent on food has declined continuously, and almost all of the decline has been represented by food consumed at home, yet today’s disposable income buys more calories than it has in the past. Relative prices have encouraged shifts across food types. From a baseline of 100 during 1982–84, the price index for fresh fruit and vegetables increased to 258 by 2002 (far exceeding general inflation), whereas the price index for soft drinks increased only to 126 by 2002 (below general inflation)." [cdc.gov/ pcd/ issues/ 2005/ apr/ 04_ 0039.htm]
The line chart example "Relative price changes for fresh fruits and vegetables, sugars, sweets, soft drinks" was created using the ConceptDraw PRO diagramming and vector drawing software extended with the Line Graphs solution from the Graphs and Charts area of ConceptDraw Solution Park.
Line chart
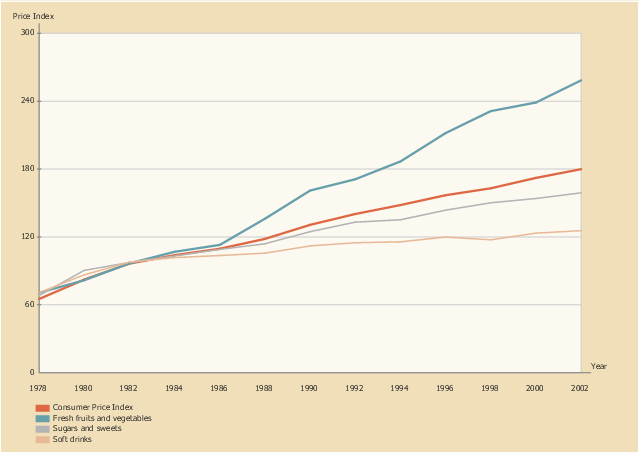
Chart Maker for Presentations

Line Chart Template for Word

This sample shows the Line Chart of annual percentage change. The Line Chart allows you to clearly see the changes of data over the time.
What Is a Line Chart

Line Charts

HelpDesk
How to Draw a Line Chart Quickly

Chart Software for Better Presentations

Graphs and Charts Area provide a wide collection of professional looking predesigned templates, samples and ready-to-use vector stencils that will help you to draw the charts and diagrams of various types: Pie Charts, Donut Charts, Line Charts, Column Charts, Bar Charts, Pyramids, Scatter Charts, Venn Diagrams, Spider Charts, Area Charts, Divided Bar Graphs.
 Area Charts
Area Charts are used to display the cumulative totals over time using numbers or percentages; or to show trends over time among related attributes. The Area Chart is effective when comparing two or more quantities. Each series of data is typically represented with a different color, the use of color transparency in an object’s transparency shows overlapped areas and smaller areas hidden behind larger areas.
- Graph Of Current Trends In Business Management
- Human Resource Current Trends With Graph Or Diagram
- Graphs And Diagrams That Illustrates The Current Trends Of Human ...
- Current Trends In The Industry Of Business Management Graph
- Graph Or Diagram That Illustrates The Current Trends In Business
- Graph Or Pie Chat That Illustrates Current Trends In Human Resource
- Which Graph To Illustrates The Current Trends In Human Resource ...
- Graph Showing Current Trends In Business Industry
- Graph Or Diagram That Illustrates The Current Trends In Information
- Dashboard | Graph For Business Management Current Trends
- Dashboard | Current Trends And Graphs In Business Management
- Current Trends Graph In Huma Resourse
- Dashboard | Graph Or Diagram Of Current Trends In Business ...
- Dashboard | USA Maps | Graph Of The Current Trends In Business ...
- Current Trends And Graphs In Human Resources
- Current Trends Of The Business Managent Shown By Graphs Or
- Current Trends Of Human Resource Illustration Of A Graph
- A Graph Or Diagram On The Currect Trends In Information Technology
- Current Trends In Network Management Graphs
- Currents Trends In It In Network Management Graph
- ERD | Entity Relationship Diagrams, ERD Software for Mac and Win
- Flowchart | Basic Flowchart Symbols and Meaning
- Flowchart | Flowchart Design - Symbols, Shapes, Stencils and Icons
- Flowchart | Flow Chart Symbols
- Electrical | Electrical Drawing - Wiring and Circuits Schematics
- Flowchart | Common Flowchart Symbols
- Flowchart | Common Flowchart Symbols