"A catalog merchant (catalogue merchant in British and Canadian English) is a form of retailing. The typical merchant sells a wide variety of household and personal products, with many emphasizing jewelry. Unlike a self-serve retail store, most of the items are not displayed; customers select the products from printed catalogs in the store and fill out an order form. The order is brought to the sales counter, where a clerk retrieves the items from the warehouse area to a payment and checkout station. ...
The catalog merchant has generally lower prices than other retailers and lower overhead expenses due to the smaller size of store and lack of large showroom space.
There are a few key benefits to this approach. By operating as an in-store catalog sales center, it could be exempt from the "Resale price maintenance" policy of the manufacturers, which can force conventional retailers to charge a minimum sales price to prevent price-cutting competition; it also reduces the risk of merchandise theft, known in the industry as shrinkage.
From the consumer's point of view, there are potential advantages and disadvantages. The catalog showroom approach allows customers to shop without having to carry their purchases throughout the store as they shop. Possible downsides include that customers may be required to give their contact information when an order is placed, take the time to fill out order forms, and wait a period of time for their order to be available for purchase. This wait may be days long, one of the chief vulnerabilities of the catalog showroom approach." [Catalog merchant. Wikipedia]
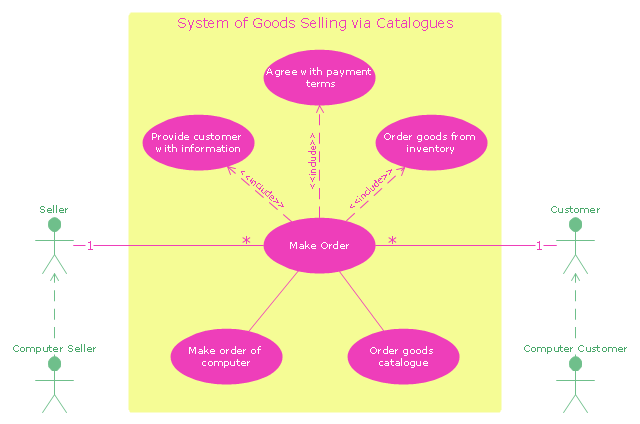
The UML use case diagram example "System of goods selling via catalogues" was created using the ConceptDraw PRO diagramming and vector drawing software extended with the Rapid UML solution from the Software Development area of ConceptDraw Solution Park.
The catalog merchant has generally lower prices than other retailers and lower overhead expenses due to the smaller size of store and lack of large showroom space.
There are a few key benefits to this approach. By operating as an in-store catalog sales center, it could be exempt from the "Resale price maintenance" policy of the manufacturers, which can force conventional retailers to charge a minimum sales price to prevent price-cutting competition; it also reduces the risk of merchandise theft, known in the industry as shrinkage.
From the consumer's point of view, there are potential advantages and disadvantages. The catalog showroom approach allows customers to shop without having to carry their purchases throughout the store as they shop. Possible downsides include that customers may be required to give their contact information when an order is placed, take the time to fill out order forms, and wait a period of time for their order to be available for purchase. This wait may be days long, one of the chief vulnerabilities of the catalog showroom approach." [Catalog merchant. Wikipedia]
The UML use case diagram example "System of goods selling via catalogues" was created using the ConceptDraw PRO diagramming and vector drawing software extended with the Rapid UML solution from the Software Development area of ConceptDraw Solution Park.
UML use case diagram
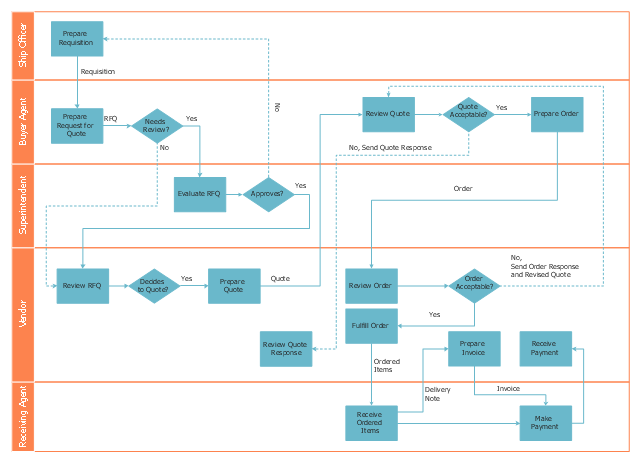
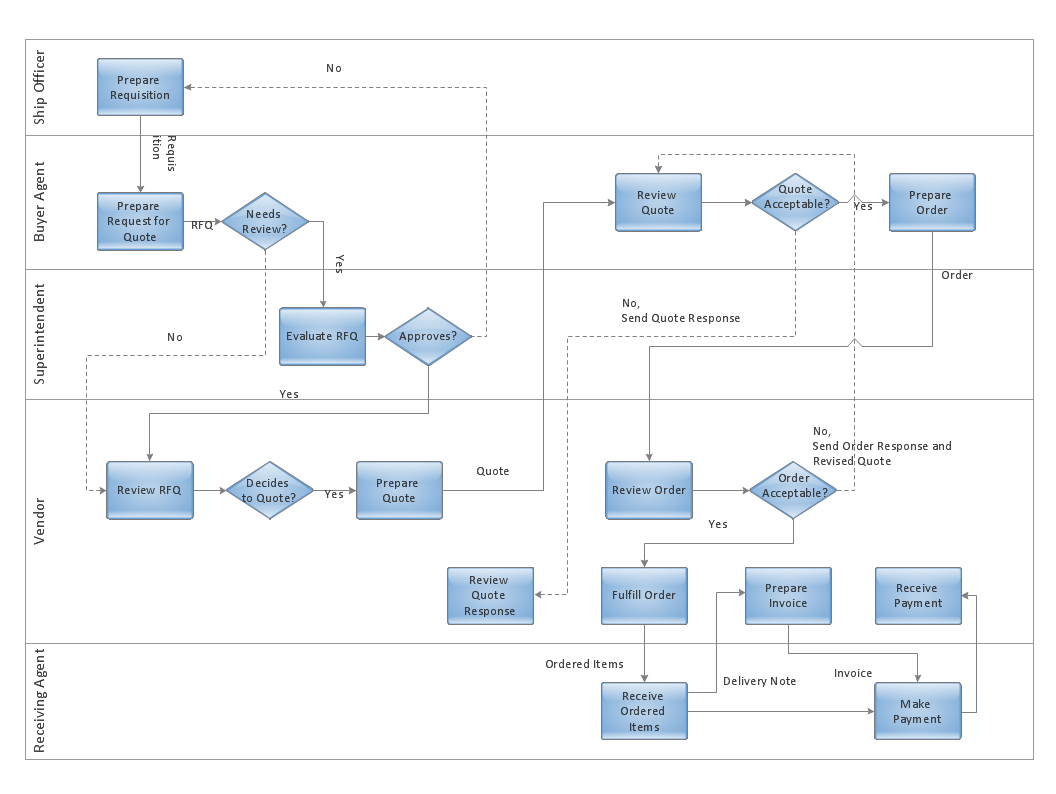
This deployment flow chart sample shows the trading process flow.
"Trade, also called goods exchange economy, is to transfer the ownership of goods from one person or entity to another by getting something in exchange from the buyer. Trade is sometimes loosely called commerce or financial transaction or barter. A network that allows trade is called a market. ...
Modern traders ... generally negotiate through a medium of exchange, such as money. As a result, buying can be separated from selling, or earning. ...
Retail trade consists of the sale of goods or merchandise from a very fixed location, such as a department store, boutique or kiosk, or by mail, in small or individual lots for direct consumption by the purchaser. Wholesale trade is defined as the sale of goods that are sold merchandise to retailers, to industrial, commercial, institutional, or other professional business users, or to other wholesalers and related subordinated services." [Trade. Wikipedia]
The swim lane diagram example "Deployment flowchart - Trading process diagram" was created using the ConceptDraw PRO diagramming and vector drawing software extended with the Cross-Functional Flowcharts solution from the Business Processes area of ConceptDraw Solution Park.
Swim lane diagram
 Rapid UML
Rapid UML solution extends ConceptDraw DIAGRAM software with templates, samples and libraries of vector stencils for quick drawing the UML diagrams using Rapid Draw technology.
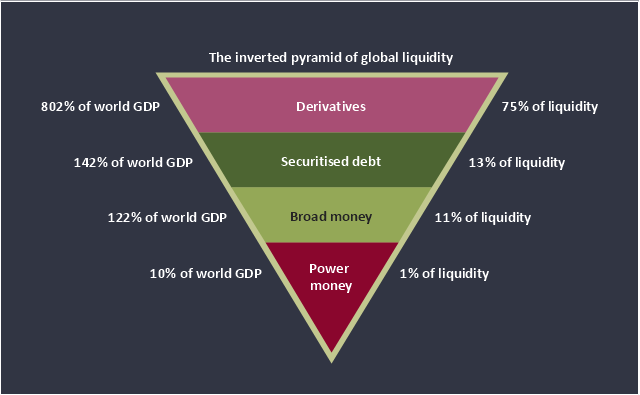
This inverted pyramid diagram of global liquidity shows world GDP and liquidity for 4 levels: derivatives, securitised debt, broad money, and power money.
"In business, economics or investment, market liquidity is a market's ability to facilitate an asset being sold quickly without having to reduce its price very much (or even at all). Equivalently, an asset's market liquidity (or simply "an asset's liquidity") is the asset's ability to sell quickly without having to reduce its price very much. Liquidity is about how big the trade-off is between the speed of the sale and the price it can be sold for. In a liquid market, the trade-off is mild: selling quickly will not reduce the price much. In a relatively illiquid market, selling it quickly will require cutting its price by some amount.
Money, or cash, is the most liquid asset, because it can be "sold" for goods and services instantly with no loss of value. There is no wait for a suitable buyer of the cash. There is no trade-off between speed and value. It can be used immediately to perform economic actions like buying, selling, or paying debt, meeting immediate wants and needs.
If an asset is moderately (or very) liquid, it has moderate (or high) liquidity. In an alternative definition, liquidity can mean the amount of highly liquid assets. If a business has moderate liquidity, it has a moderate amount of very liquid assets. If a business has sufficient liquidity, it has a sufficient amount of very liquid assets and the ability to meet its payment obligations." [Market liquidity. Wikipedia]
This inverted triangle diagram was redesigned using the ConceptDraw PRO diagramming and vector drawing software from Wikimedia Commons file The inverted pyramid of global liquidity.gif. [commons.wikimedia.org/ wiki/ File:The_ inverted_ pyramid_ of_ global_ liquidity.gif]
This triangular chart example is included in the Pyramid Diagrams solution from the Marketing area of ConceptDraw Solution Park.
Inverted pyramid diagram
Cross-Functional Flowcharts in ConceptDraw
Software development with ConceptDraw DIAGRAM

- UML use case diagram - System of goods selling via catalogues ...
- ATM UML Diagrams | UML use case diagram - System of goods ...
- UML use case diagram - System of goods selling via catalogues
- IDEF4 Standard | UML use case diagram - System of goods selling ...
- Use Case Diagram For Purchase Sysyem
- Draw Flowchart To Sell Goods
- Diagram Of Selling
- Solution Selling
- Flow Chart Of Direct Selling
- Sales Process Flowchart. Flowchart Examples | Decision Tree ...
- Selling Product Diagram Example
- Flowchart For Buying Goods
- Service- goods continuum diagram | Flow chart Example ...
- Data flow diagram (DFD) - Payment for goods using UPS code ...
- Selling Process Wikipedia
- Selling Peocess Diagram
- Selling Price Of A Product Block Diagram
- Diagram Of Buying And Selling
- Buying And Selling Flow Chart Of Business Process Service
- Concept Map Selling
- ERD | Entity Relationship Diagrams, ERD Software for Mac and Win
- Flowchart | Basic Flowchart Symbols and Meaning
- Flowchart | Flowchart Design - Symbols, Shapes, Stencils and Icons
- Flowchart | Flow Chart Symbols
- Electrical | Electrical Drawing - Wiring and Circuits Schematics
- Flowchart | Common Flowchart Symbols
- Flowchart | Common Flowchart Symbols