"Ecosystems represent sources of natural capital and provide goods and services to society, also called ecosystem services. The Millennium Ecosystem Assessment identified over 24 ecosystem services that can be divided up into 4 general groups including: 1) provisioning, 2) supporting, 3) regulating and 4) cultural." [User:Sawtoothgirl/ Sustainable Real Estate Development. Wikipedia]
"Humankind benefits in a multitude of ways from ecosystems. Collectively, these benefits are known as ecosystem services. Ecosystem services are regularly involved in the provisioning of clean drinking water and the decomposition of wastes. While scientists and environmentalists have discussed ecosystem services implicitly for decades, these the ecosystem services concept itself was popularized by the Millennium Ecosystem Assessment (MA) in the early 2000s. This grouped ecosystem services into four broad categories: provisioning, such as the production of food and water; regulating, such as the control of climate and disease; supporting, such as nutrient cycles and crop pollination; and cultural, such as spiritual and recreational benefits. To help inform decision-makers, many ecosystem services are being assigned economic values." [Ecosystem services. Wikipedia]
The segmented pyramid diagram example "Ecosystem goods and services" was redesigned using the ConceptDraw PRO diagramming and vector drawing software from Wikimedia Commons file ES_ triangle.png.
[commons.wikimedia.org/ wiki/ File:ES_ triangle.png]
This file is licensed under the Creative Commons Attribution-Share Alike 3.0 Unported license. [creativecommons.org/ licenses/ by-sa/ 3.0/ deed.en]
This segmented pyramid diagram example "Ecosystem goods and services" is included in the Pyramid Diagrams solution from the Marketing area of ConceptDraw Solution Park.
Pyramid diagram

Pyramid Diagram

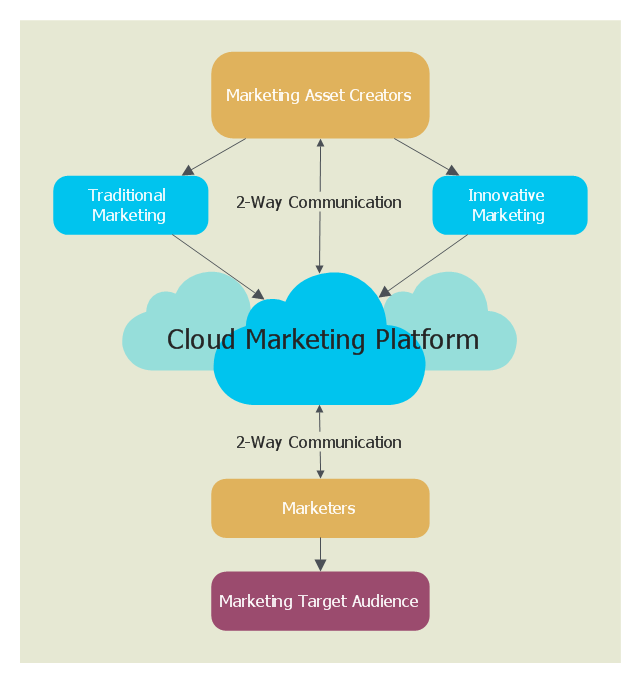
This cloud computing diagram example was drawn on the base of Wikimedia Commons file: CloudMarketingDiagram.png. [commons.wikimedia.org/ wiki/ File:CloudMarketingDiagram.png]
This file is licensed under the Creative Commons Attribution 3.0 Unported license. [creativecommons.org/ licenses/ by/ 3.0/ deed.en]
"Cloud marketing is the process of an organisations efforts to market their goods and services online through integrated digital experiences, by which they are specialised for every single end user. The aim is to use advertising methods to target customers via online applications through social media websites such as Facebook, Twitter and various online portals to target consumers. Cloud marketing platforms are supported with third parties which maintain the platform." [Cloud marketing. Wikipedia]
The example "Cloud marketing diagram" was drawn using ConceptDraw PRO software extended with the Cloud Computing Diagrams solution from the Computer and Networks area of ConceptDraw Solution Park.
Cloud computing diagram example
This cause and effect diagram sample was redesigned from the Wikimedia Commons file: Ursache Wirkung Diagramm Beispiel.png. [commons.wikimedia.org/ wiki/ File:Ursache_ Wirkung_ Diagramm_ Beispiel.png]
This file is licensed under the Creative Commons Attribution-Share Alike 3.0 Unported license. [creativecommons.org/ licenses/ by-sa/ 3.0/ deed.en]
"Productivity is the ratio of output to inputs in production; it is an average measure of the efficiency of production. Efficiency of production means production’s capability to create incomes which is measured by the formula real output value minus real input value.
Productivity is a crucial factor in production performance of firms and nations. Increasing national productivity can raise living standards because more real income improves people's ability to purchase goods and services, enjoy leisure, improve housing and education and contribute to social and environmental programs. Productivity growth also helps businesses to be more profitable." [Productivity. Wikipedia]
The fishbone diagram example "Increase in productivity" was created using the ConceptDraw PRO diagramming and vector drawing software extended with the Fishbone Diagrams solution from the Management area of ConceptDraw Solution Park.
Ishikawa diagram

Pyramid Chart Examples

Pyramid Diagram

Pyramid Diagram

This exploded pie chart sample shows the economic sector weightings. It was designed on the base of the Wikimedia Commons file: Badpie.png [commons.wikimedia.org/ wiki/ File:Badpie.png].
This image is available under the Creative Commons Attribution-ShareAlike 3.0 Unported License [creativecommons.org/ licenses/ by-sa/ 3.0/ ].
"The classical breakdown of all economic sectors follows:
Primary: Involves the retrieval and production of raw materials, such as corn, coal, wood and iron. (A coal miner and a fisherman would be workers in the primary sector.)
Secondary: Involves the transformation of raw or intermediate materials into goods e.g. manufacturing steel into cars, or textiles into clothing. (A builder and a dressmaker would be workers in the secondary sector.)
Tertiary: Involves the supplying of services to consumers and businesses, such as baby-sitting, cinema and banking. (A shopkeeper and an accountant would be workers in the tertiary sector.)
In the 20th century, it began to be argued that traditional tertiary services could be further distinguished from "quaternary" and quinary service sectors." [Economic sector. Wikipedia]
The exploded pie chart example "Economic sector weightings" was created using the ConceptDraw PRO diagramming and vector drawing software extended with the Pie Charts solution of the Graphs and Charts area in ConceptDraw Solution Park.
Exploded pie chart

Chart Templates

Chart Examples

How to Create a Line Chart

How to Draw a Line Graph

HelpDesk
How to Draw a Line Chart Quickly

Diagram of a Pyramid

Competitor Analysis

- Png Clipart Bank Check
- Orange Triangle Png
- Dna Vector Png
- Goal Png
- Ecosystem goods and services - Segmented pyramid diagram ...
- Citric acid cycle (TCA cycle) | Ecosystem goods and services ...
- Dna Png
- 3d Pyramid With 5 Levels Png
- Service-goods continuum diagram | Ecosystem goods and services ...
- Foods Draw Png
- Healthy Foods | Energy Pyramid Diagram | Ecosystem goods and ...
- Ecosystem goods and services - Segmented pyramid diagram ...
- Design Club Soccer Png
- Success Vector Png
- Ecosystem goods and services - Segmented pyramid diagram ...
- Venn Diagram | Basic Audit Flowchart. Flowchart Examples ...
- Time Vector Png High Quality
- Hierarchy of laws | Typography Art | Pyramid Diagram | Png ...
- Png Series
- Triangle Png
- ERD | Entity Relationship Diagrams, ERD Software for Mac and Win
- Flowchart | Basic Flowchart Symbols and Meaning
- Flowchart | Flowchart Design - Symbols, Shapes, Stencils and Icons
- Flowchart | Flow Chart Symbols
- Electrical | Electrical Drawing - Wiring and Circuits Schematics
- Flowchart | Common Flowchart Symbols
- Flowchart | Common Flowchart Symbols