Export from ConceptDraw DIAGRAM Document to a Graphic File

ConceptDraw DIAGRAM can save your drawings and diagrams in a number of highly useful formats, including graphic files. You can save your drawing as a.PNG,.JPG, or other graphic format file.

 Business Process Workflow Diagrams
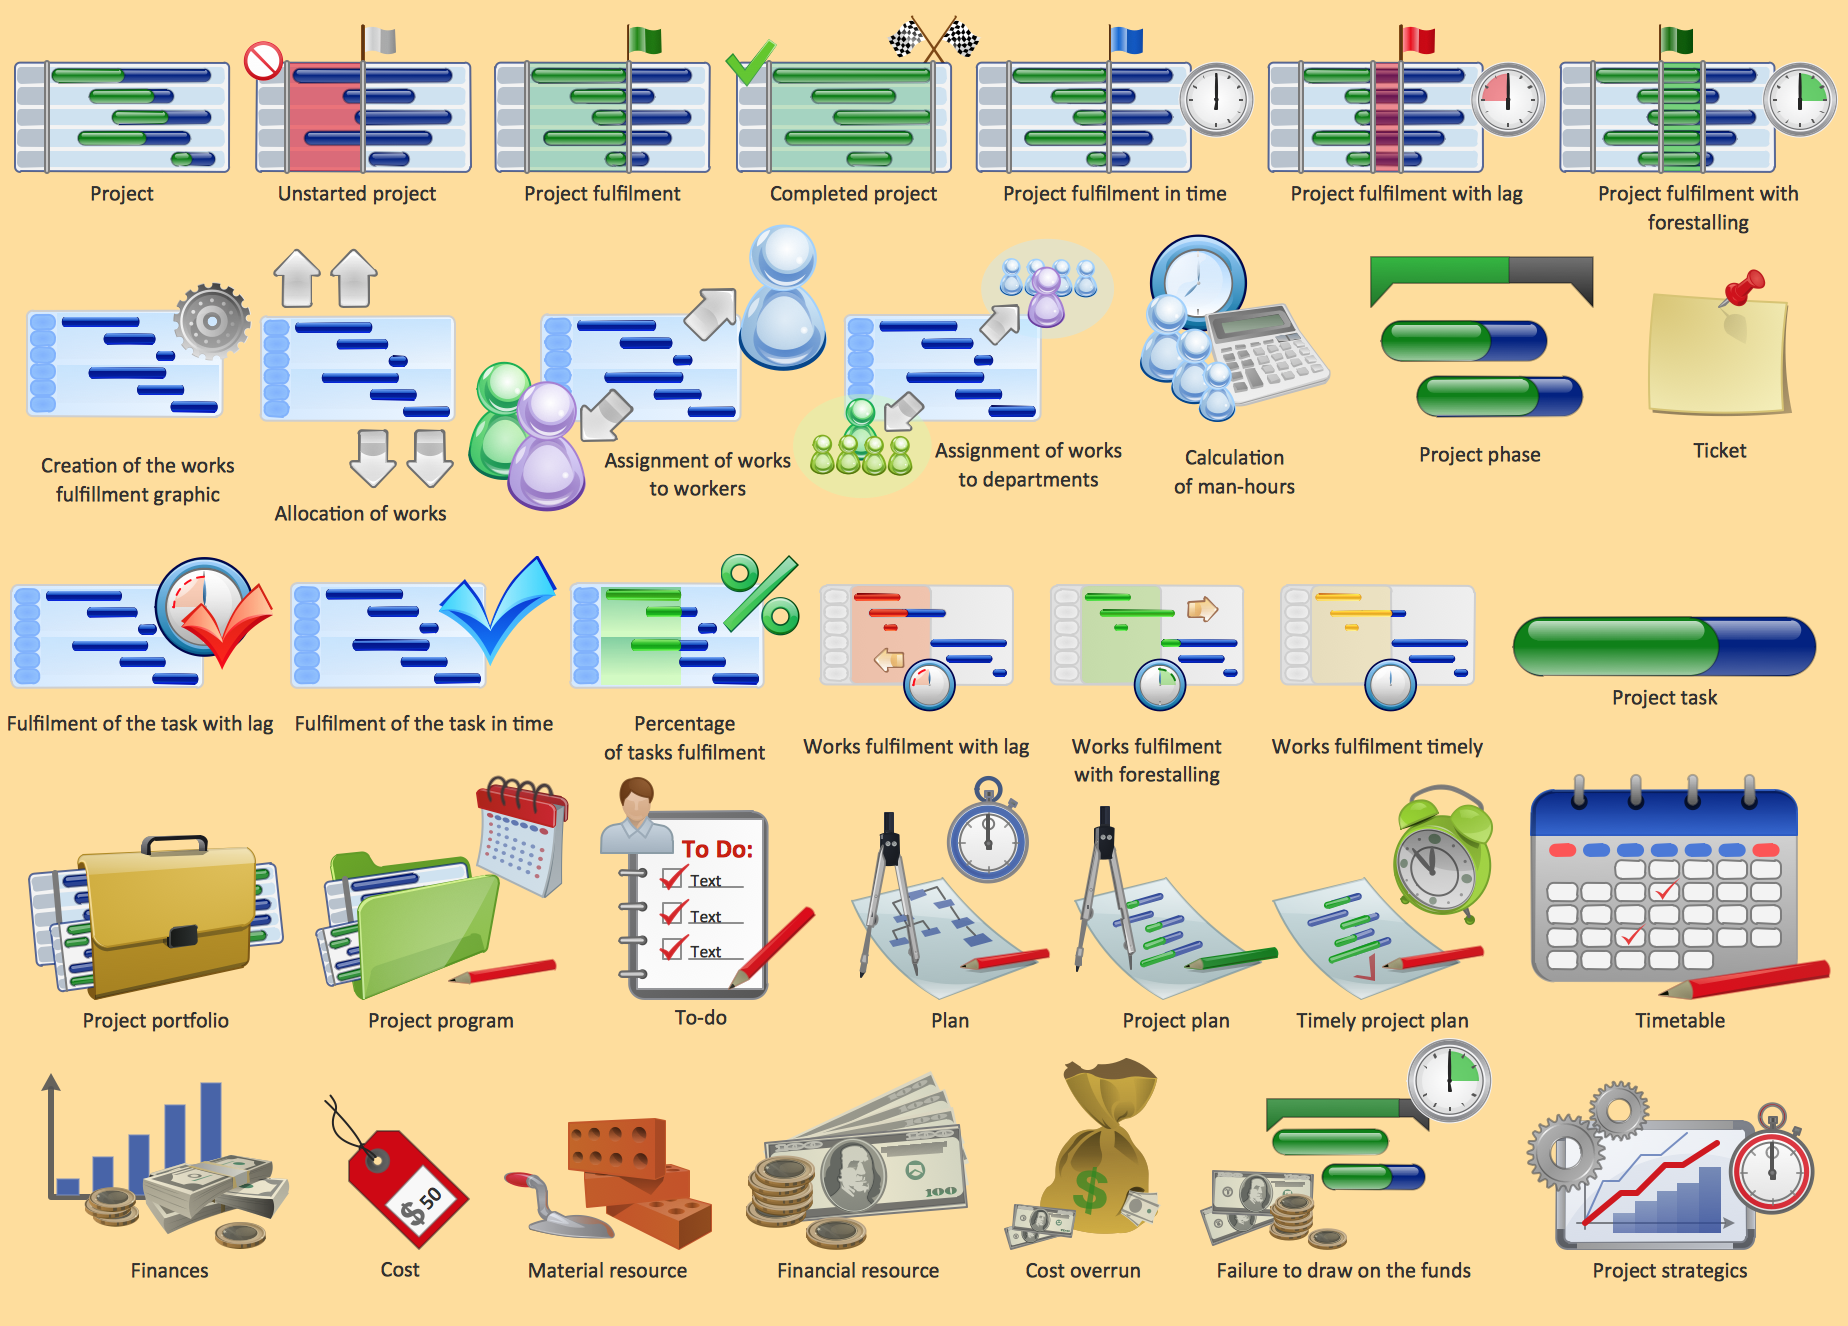
The Business Process Workflow Diagrams solution enhances the ConceptDraw DIAGRAM functionality with predesigned examples, samples and a numerous collection of predesigned vector objects of workflow chart elements, icons, arrows, connectors, and varied wor
Project management - Design Elements
 HR Flowcharts
Human resource management diagrams show recruitment models, the hiring process and human resource development of human resources.
Business - Design Elements
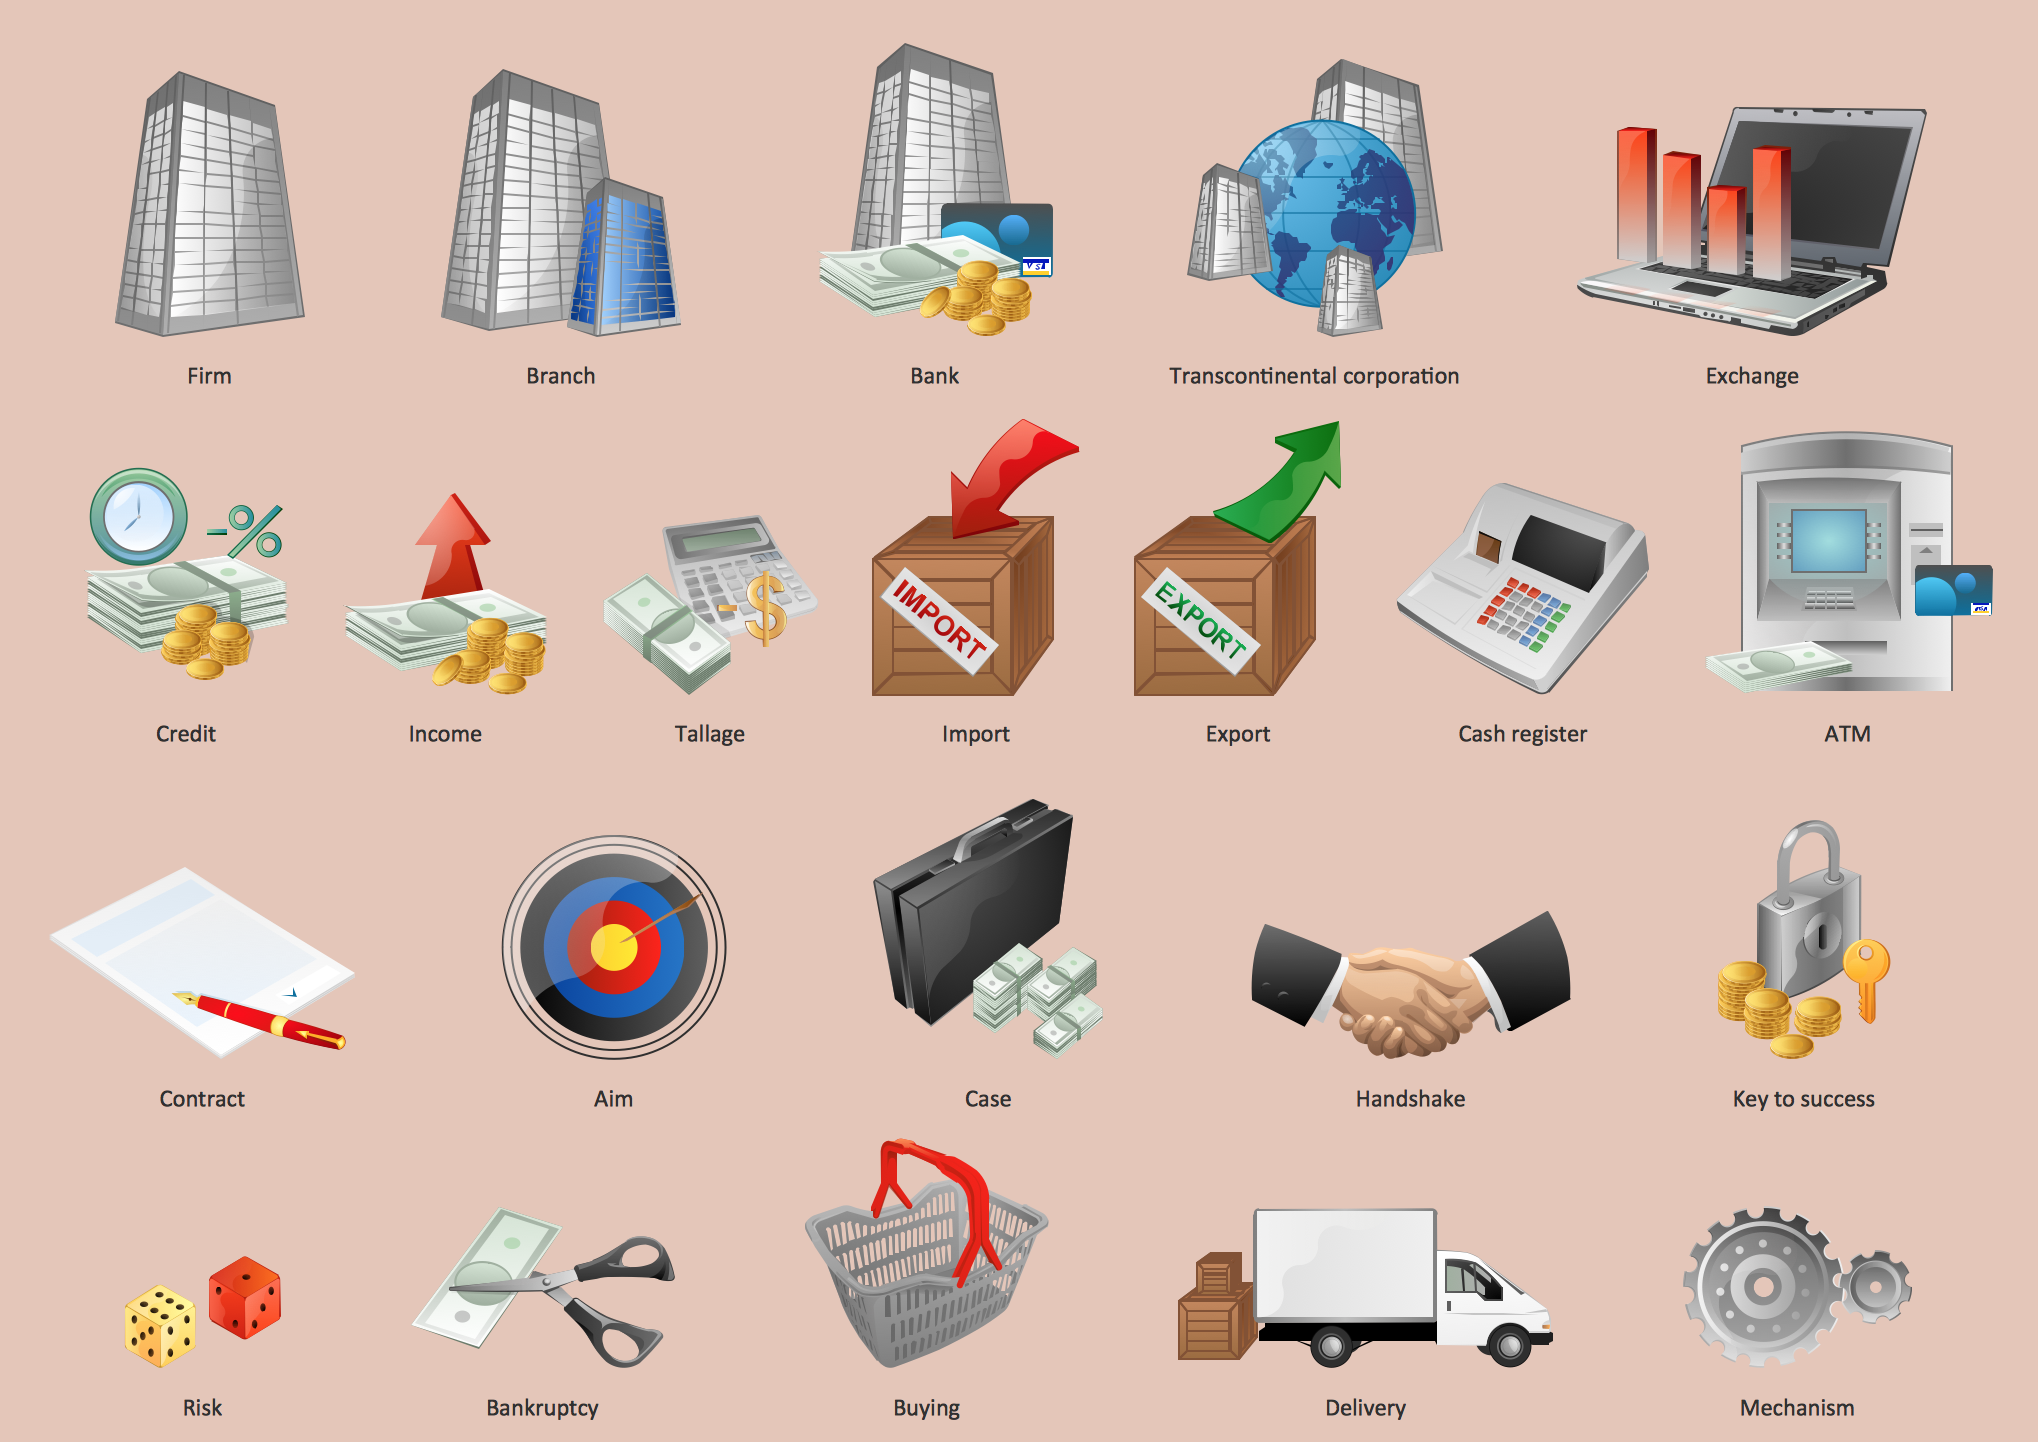
Design your own style with Business and Finance Solutions from ConceptDraw DIAGRAM.
We created a full set of elements, business samples, templates and libraries with vector clip art for drawing the Business Illustrations.
Mark your report or presentation, pay an attention of audience on your drawings with vector business design elements.
 Picture Graphs
Typically, a Picture Graph has very broad usage. They many times used successfully in marketing, management, and manufacturing. The Picture Graphs Solution extends the capabilities of ConceptDraw DIAGRAM with templates, samples, and a library of professionally developed vector stencils for designing Picture Graphs.
Design Pictorial Infographics. Design Infographics

Emergency Plan


Winter Sports Vector Clipart. Medal Map. Spatial Infographics

 Area Charts
Area Charts are used to display the cumulative totals over time using numbers or percentages; or to show trends over time among related attributes. The Area Chart is effective when comparing two or more quantities. Each series of data is typically represented with a different color, the use of color transparency in an object’s transparency shows overlapped areas and smaller areas hidden behind larger areas.
- Png Hand Shake
- Finance - Vector stencils library | Business People Clipart | Business ...
- Finance - Vector stencils library | Business People Clipart ...
- Currency - Vector stencils library | Business - Vector stencils library ...
- Supply chain network | A company's supply chain | Groups in a ...
- Png Text Attitude
- Building Clipart Png
- Bank Branch Icon Png
- HR symbols - Vector stencils library | Business - Vector stencils ...
- Partnership Clipart Png
- ERD | Entity Relationship Diagrams, ERD Software for Mac and Win
- Flowchart | Basic Flowchart Symbols and Meaning
- Flowchart | Flowchart Design - Symbols, Shapes, Stencils and Icons
- Flowchart | Flow Chart Symbols
- Electrical | Electrical Drawing - Wiring and Circuits Schematics
- Flowchart | Common Flowchart Symbols
- Flowchart | Common Flowchart Symbols