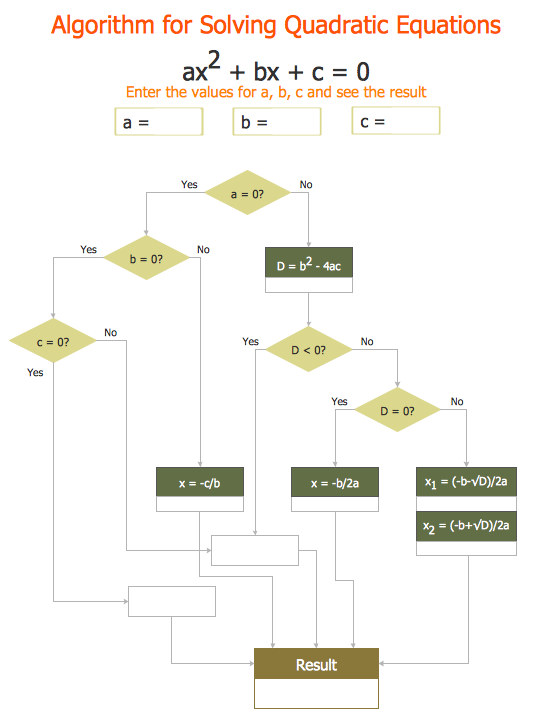
Basic Flowchart Symbols and Meaning


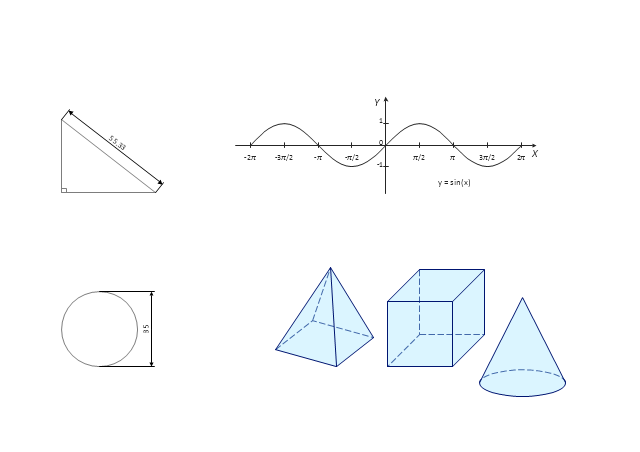
Mathematical Diagrams
Mathematics solution provides 3 libraries: Plane Geometry Library, Solid Geometry Library, Trigonometric Functions Library.
Physics Symbols

Physics solution provides all tools that you can need for physics diagrams designing. It includes 3 libraries with predesigned vector physics symbols: Optics Library, Mechanics Library and Nuclear Physics Library.
Use this mathematical drawings and graphs template to create your own math illustrations using the shapes of plane and solid geometric figures as well as trigonometric functions.
"Mathematical visualization or mathematical visualization is an aspect of geometry which allows one to understand and explore mathematical phenomena via visualization. Classically this consisted of two-dimensional drawings or building three-dimensional models (particularly plaster models in the 19th and early 20th century), while today it most frequently consists of using computers to make static two or three dimensional drawings, animations, or interactive programs. Writing programs to visualize mathematics is an aspect of computational geometry." [Mathematical visualization. Wikipedia]
The math illustrations template for the ConceptDraw PRO diagramming and vector drawing software is included in the Mathematics solution from the Science and Education area of ConceptDraw Solution Park.
Mathematical drawings and graphs
 Mathematics
Mathematics solution extends ConceptDraw DIAGRAM software with templates, samples and libraries of vector stencils for drawing the mathematical illustrations, diagrams and charts.
Chemistry Drawings

that can be then successfully used in the field of science and education, on various conferences, and so on.
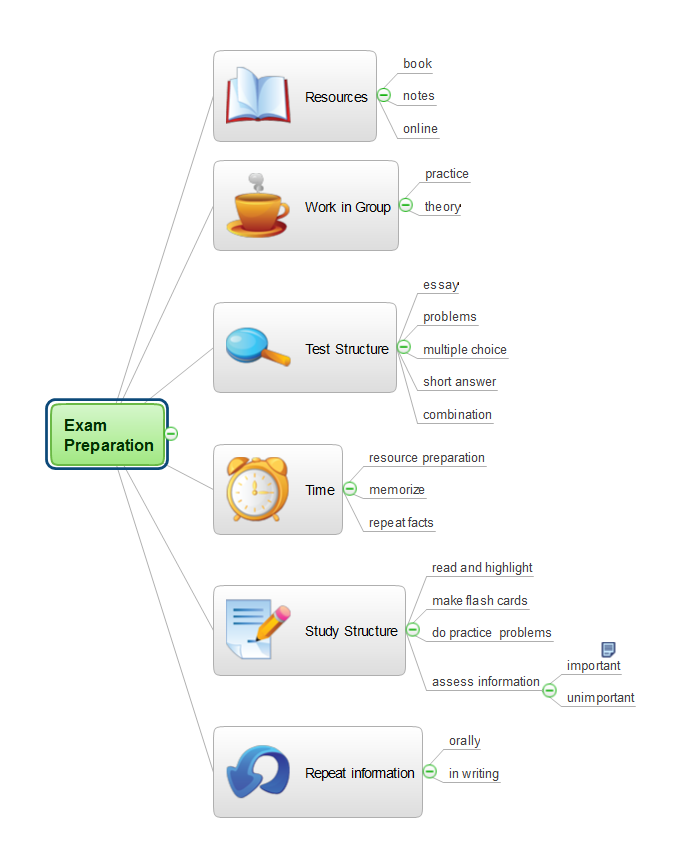
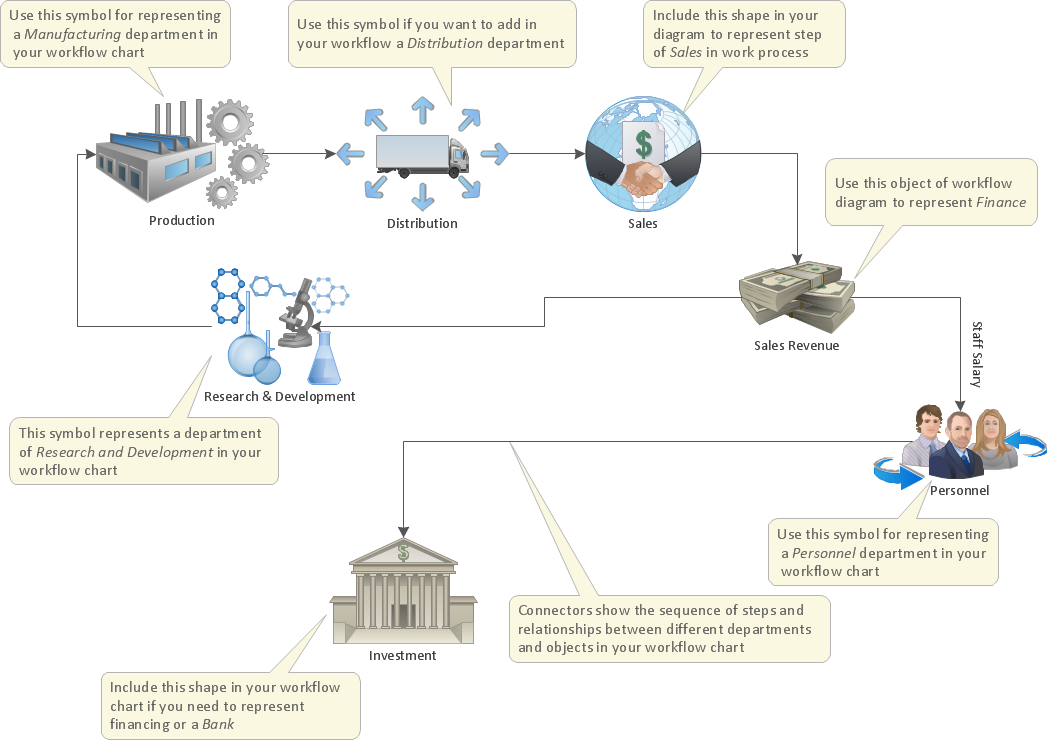
Optimize a Workflow
Chemistry Drawing Software
- Design elements - Solid geometry | Geometrical Drawing Program
- Software For Drawing Mathematical Diagrams
- How to Draw Geometric Shapes in ConceptDraw PRO | Solid ...
- Welded joints types | Butt weld geometry | Elements location of a ...
- How to Draw Geometric Shapes in ConceptDraw PRO | How to ...
- Software To Draw Geometric Shapes
- How to Draw Geometric Shapes in ConceptDraw PRO | Mechanical ...
- Free Math Draw Software
- How To Draw Figure In Geometry Fast Way To Solution
- Geometry Drawing Software
- ERD | Entity Relationship Diagrams, ERD Software for Mac and Win
- Flowchart | Basic Flowchart Symbols and Meaning
- Flowchart | Flowchart Design - Symbols, Shapes, Stencils and Icons
- Flowchart | Flow Chart Symbols
- Electrical | Electrical Drawing - Wiring and Circuits Schematics
- Flowchart | Common Flowchart Symbols
- Flowchart | Common Flowchart Symbols