Scientific Symbols Chart
ConceptDraw PRO is the beautiful design software that provides many vector stencils, examples and templates for drawing different types of illustrations and diagrams.Mathematics Solution from the Science and Education area of ConceptDraw Solution Park includes a few shape libraries of plane, solid geometric figures, trigonometrical functions and greek letters to help you create different professional looking mathematic illustrations for science and education.
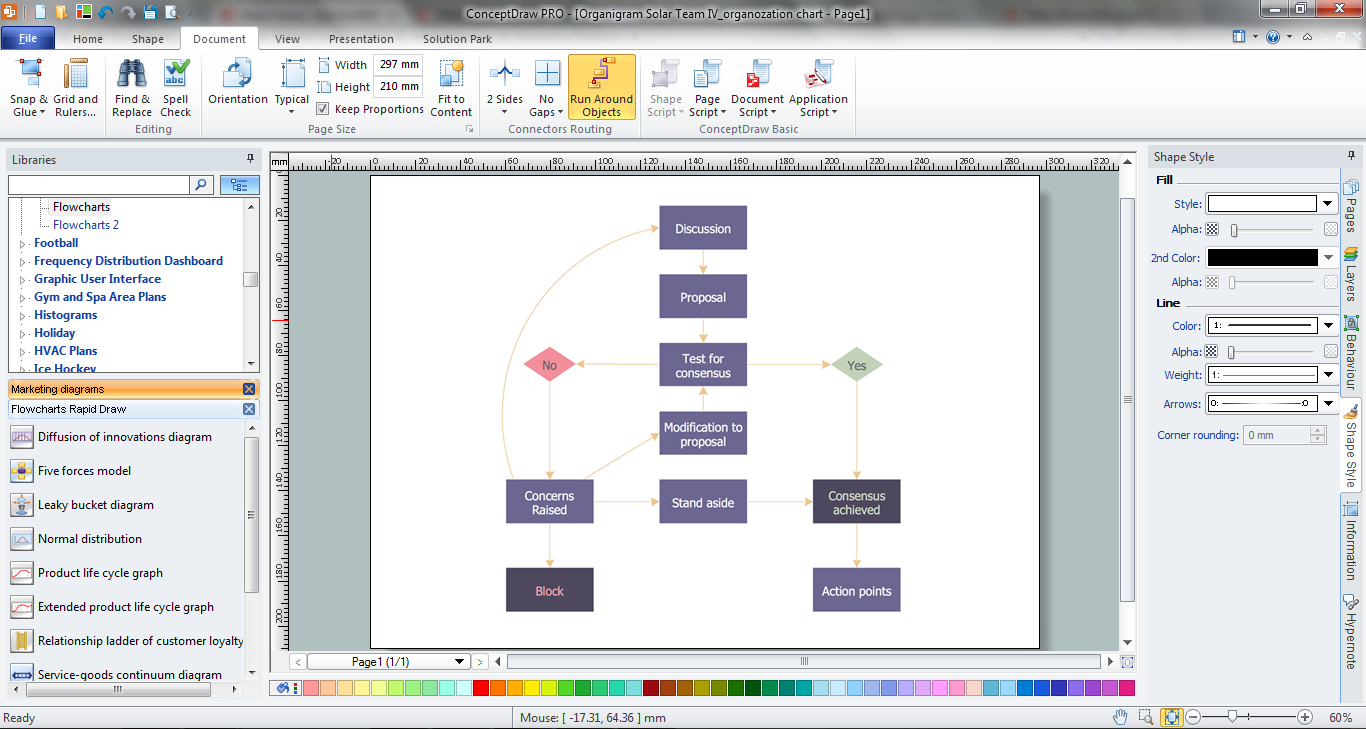
Basic Flowchart Symbols and Meaning
Flowchart Symbols and Meaning - Provides a visual representation of basic flowchart symbols and their proposed use in professional workflow diagram, standard process flow diagram and communicating the structure of a well-developed web site, as well as their correlation in developing on-line instructional projects. See flowchart's symbols by specifics of process flow diagram symbols and workflow diagram symbols.
Mathematical Diagrams
ConceptDraw PRO diagramming and vector drawing software extended with Mathematics solution from the Science and Education area is the best for creating: mathematical diagrams, graphics, tape diagrams various mathematical illustrations of any complexity quick and easy.Mathematics solution provides 3 libraries: Plane Geometry Library, Solid Geometry Library, Trigonometric Functions Library.
Flowchart of Products. Flowchart Examples
This sample shows the Flowchart of the Sustainment and Disposal.A Flowchart is a graphically representation of the process that step-by-step lead to the solution the problem. The geometric figures on the Flowchart represent the steps of the process and are connected with arrows that show the sequence of the actions. The Flowcharts are widely used in engineering, architecture, science, analytics, government, politics, business, marketing, manufacturing, administration, etc.
Mathematics Symbols
ConceptDraw PRO extended with Mathematics solution from the Science and Education area is a powerful diagramming and vector drawing software that offers all needed tools for mathematical diagrams designing.Mathematics solution provides 3 libraries with predesigned vector mathematics symbols and figures:
Solid Geometry Library, Plane Geometry Library and Trigonometric Functions Library.
Horizontal Flowchart
This sample was created in ConceptDraw PRO diagramming and vector drawing software using the Flowcharts solution from the Diagrams area of ConceptDraw Solution Park.A Flowchart is a graphically representation of the process, algorithm or the step-by-step solution of the problem. The Flowcharts have one or more starting and ending points. The geometric figures on the Flowcharts represent the steps of the process and are connected with arrows that show the sequence of the actions.
Marketing Flow Chart
ConceptDraw PRO diagramming and vector drawing software extended with Marketing Diagrams Solution from the Marketing Area of ConceptDraw Solution Park is the best software for quick and easy creating Marketing Flow Chart of any complexity and design.Basic Diagramming
Mathematical Drawing Software - Draw mathematical illustration diagrams easily from examples and templates!
Sample Project Flowchart. Flowchart Examples
This sample shows the Flowchart that displays the architecture of SQL Exception Translation.This sample was created in ConceptDraw PRO diagramming and vector drawing software using the Flowcharts solution from the Diagrams area of ConceptDraw Solution Park.

Bar Diagrams for Problem Solving. Create space science bar charts with Bar Graphs Solution
Bar charts represent data in different categories or groups.Create bar graphs for visual solving your scientific problems and data comparison using the ConceptDraw PRO diagramming and vector drawing software extended with the Bar Graphs Solution from the Graphs and Charts area of ConceptDraw Solition Park.
Business Board Org Chart
This sample was created in ConceptDraw PRO diagramming and vector drawing software using the Organizational Charts Solution from the Software Development area of ConceptDraw Solution Park.This sample shows the organizational chart in the field of Architect Engineering. Create your own orgchart professional drawings using ConceptDraw.
Astronomy Symbols
Are you an astronomer, astronomy teacher or student? And you need to draw astronomy pictures quick and easy? ConceptDraw PRO diagramming and vector drawing software extended with Astronomy solution from the Science and Education area will help you!Astronomy solution provides 7 libraries with wide variety of predesigned vector objects of astronomy symbols, celestial bodies, solar system symbols, constellations, etc.
Sales Process Flowchart Symbols
The most easier way of creating the visually engaging and informative Sales Process Flowchart is to create the new ConceptDraw document and to use the predesigned vector symbols offered in 6 libraries of the Sales Flowchart Solution. There are more than six types of sales process flow diagrams, ConceptDraw PRO software is flowchart maker which include six collections of extended flowchart symbols for effective diagramming. There are main collections of color coded flowchart symbols: Sales Department, Sales Steps, Sales Workflow, Sales Symbols and special set of Sales Arrows and Sales Flowchart.Spatial Data Analysis
ConceptDraw PRO diagramming and vector drawing software extended with Pictorial Infographics Solution from the “Infographics” Area is the best for Spatial Data Analysis. You have a perfect possibility to make sure this right now.Venn Diagram Template for Word
This template shows the Venn Diagram. It was created in ConceptDraw PRO diagramming and vector drawing software using the ready-to-use objects from the Venn Diagrams Solution from the "Diagrams" area of ConceptDraw Solution Park.- Images Of All Geometrical Shapes And Figures
- Images Of Scientists Who Related To Solid Geometry
- Line Chart Template for Word | Mathematics Symbols | Flow Map ...
- Line Chart Template for Word | Physics Symbols | Physics Diagrams ...
- Physics Symbols | Line Chart Template for Word | Physics Diagrams ...
- Basic Flowchart Symbols and Meaning | Picture And Name Geometry
- Mathematics Symbols | Bar Diagram Math | Scientific Symbols Chart ...
- Pictures Using Different Mathematical Shapes
- Physics Symbols | Line Chart Template for Word | Mathematics ...
- Example Of Solid Picture
- Basic Audit Flowchart. Flowchart Examples | Basic Flowchart ...
- Physics Symbols | Physics Diagrams | Line Chart Template for Word ...
- Basic Flowchart Images . Flowchart Examples | Basic Flowchart ...
- Basic Flowchart Symbols and Meaning | Geometry Picture With Name
- Basic Flowchart Symbols and Meaning | Horizontal Flowchart ...
- How To Draw A Geometric Chart
- Scientific Symbols Chart | Basic Diagramming | Mathematics ...
- Basic Flowchart Images . Flowchart Examples | Scientific Symbols ...
- Scientific Symbols Chart | Basic Flowchart Symbols and Meaning ...
- Picture graph template
- ERD | Entity Relationship Diagrams, ERD Software for Mac and Win
- Flowchart | Basic Flowchart Symbols and Meaning
- Flowchart | Flowchart Design - Symbols, Shapes, Stencils and Icons
- Flowchart | Flow Chart Symbols
- Electrical | Electrical Drawing - Wiring and Circuits Schematics
- Flowchart | Common Flowchart Symbols
- Flowchart | Common Flowchart Symbols


