Basic Flowchart Symbols and Meaning


ERD Symbols and Meanings

The Chen's ERD notation is still used and is considered to present a more detailed way of representing entities and relationships.
To create an ERD, software engineers mainly turn to dedicated drawing software, which contain the full notation resources for their specific database design - ERD symbols and meanings. CS Odessa has released an all-inclusive Entity-Relationship Diagram (ERD) solution for their powerful drawing program, ConceptDraw PRO.

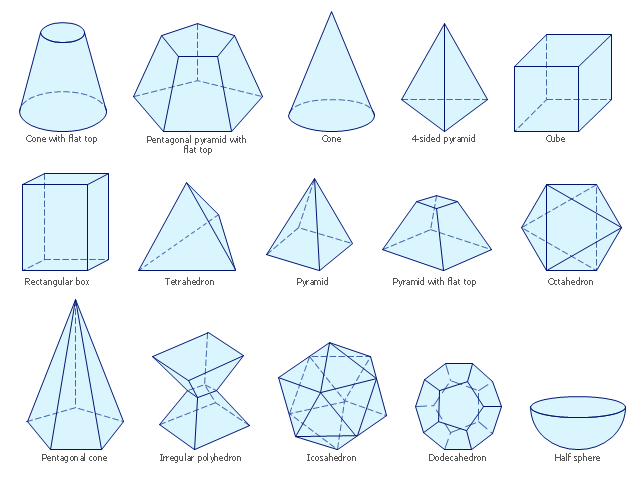
The vector stencils library "Solid geometry" contains 15 shapes of solid geometric figures.
"In mathematics, solid geometry was the traditional name for the geometry of three-dimensional Euclidean space - for practical purposes the kind of space we live in. It was developed following the development of plane geometry. Stereometry deals with the measurements of volumes of various solid figures including cylinder, circular cone, truncated cone, sphere, and prisms.
The Pythagoreans had dealt with the regular solids, but the pyramid, prism, cone and cylinder were not studied until the Platonists. Eudoxus established their measurement, proving the pyramid and cone to have one-third the volume of a prism and cylinder on the same base and of the same height, and was probably the discoverer of a proof that the volume of a sphere is proportional to the cube of its radius." [Solid geometry. Wikipedia]
The shapes example "Design elements - Solid geometry" was created using the ConceptDraw PRO diagramming and vector drawing software extended with the Mathematics solution from the Science and Education area of ConceptDraw Solution Park.
Solid geometrical figures
Entity Relationship Diagram Symbols

ERD symbols used for professional ERD drawing are collected in libraries from the Entity-Relationship Diagram (ERD) solution for ConceptDraw PRO.
Flowchart Components

Samples of Flowcharting

Technical Flow Chart

Technical Flow Chart can be drawn by pencil on the paper, but it will be easier to use for designing a special software. ConceptDraw PRO diagramming and vector drawing software extended with Flowcharts Solution from the "Diagrams" Area of ConceptDraw Solution Park will be useful for this goal.
Horizontal Flowchart

A Flowchart is a graphically representation of the process, algorithm or the step-by-step solution of the problem. The Flowcharts have one or more starting and ending points. The geometric figures on the Flowcharts represent the steps of the process and are connected with arrows that show the sequence of the actions.
Horizontal Org Flow Chart

The Organizational Chart is a diagram that shows the structure of the organization, different levels of management, hierarchy and the relationships of the organization parts.
Program Evaluation and Review Technique (PERT) with ConceptDraw PRO
")
- Design elements - Solid geometry | Names Of Solid Figures Geometry
- Names Of Solids Shapes
- Name Of Geometric Shapes Flat Top Pyramid
- Design elements - Solid geometry | Stereometric Figures
- Identifying Three Dimensional Figures With Names
- Geometric Figures Of Kinds Of Solid
- Ice Hockey | Basic Diagrams Of Geometry With Names
- Design elements - Solid geometry | Design elements - UML object ...
- Ice Hockey | Bio Flowchart Lite | Geometry Diagram Names
- Design elements - Solid geometry | Design elements - Sequence ...
- ERD | Entity Relationship Diagrams, ERD Software for Mac and Win
- Flowchart | Basic Flowchart Symbols and Meaning
- Flowchart | Flowchart Design - Symbols, Shapes, Stencils and Icons
- Flowchart | Flow Chart Symbols
- Electrical | Electrical Drawing - Wiring and Circuits Schematics
- Flowchart | Common Flowchart Symbols
- Flowchart | Common Flowchart Symbols