Mechanical Drawing Symbols
Mechanical Engineering solution — 8 libraries are available with 602 commonly used mechanical drawing symbols in Mechanical Engineering Solution, including libraries called Bearings with 59 elements of roller and ball bearings, shafts, gears, hooks, springs, spindles and keys; Dimensioning and Tolerancing with 45 elements; Fluid Power Equipment containing 113 elements of motors, pumps, air compressors, meters, cylinders, actuators and gauges; Fluid Power Valves containing 93 elements of pneumatic and hydraulic valves (directional control valves, flow control valves, pressure control valves) and electrohydraulic and electropneumatic valves; as well as many other sophisticated symbols and templates for your use.Cause and Effect Diagrams
Cause and Effect Diagrams are designed to identify the potential factors that cause an overall effect. The causes are grouped into the categories, each cause is a source of variation.ConceptDraw DIAGRAM powerful diagramming and vector drawing software provides the Fishbone Diagrams solution from the Management area of ConceptDraw Solution Park that allows to design the Cause and Effect Diagrams quick, easy and effective.
KPI Dashboard
ConceptDraw DIAGRAM diagramming and vector drawing software supplied with Sales Dashboard solution from the Marketing area of ConceptDraw Solution Park provides the full set of useful tools which make it the best for producing the live KPI Dashboard of any complexity.HelpDesk
How to Create a Meter Dashboard
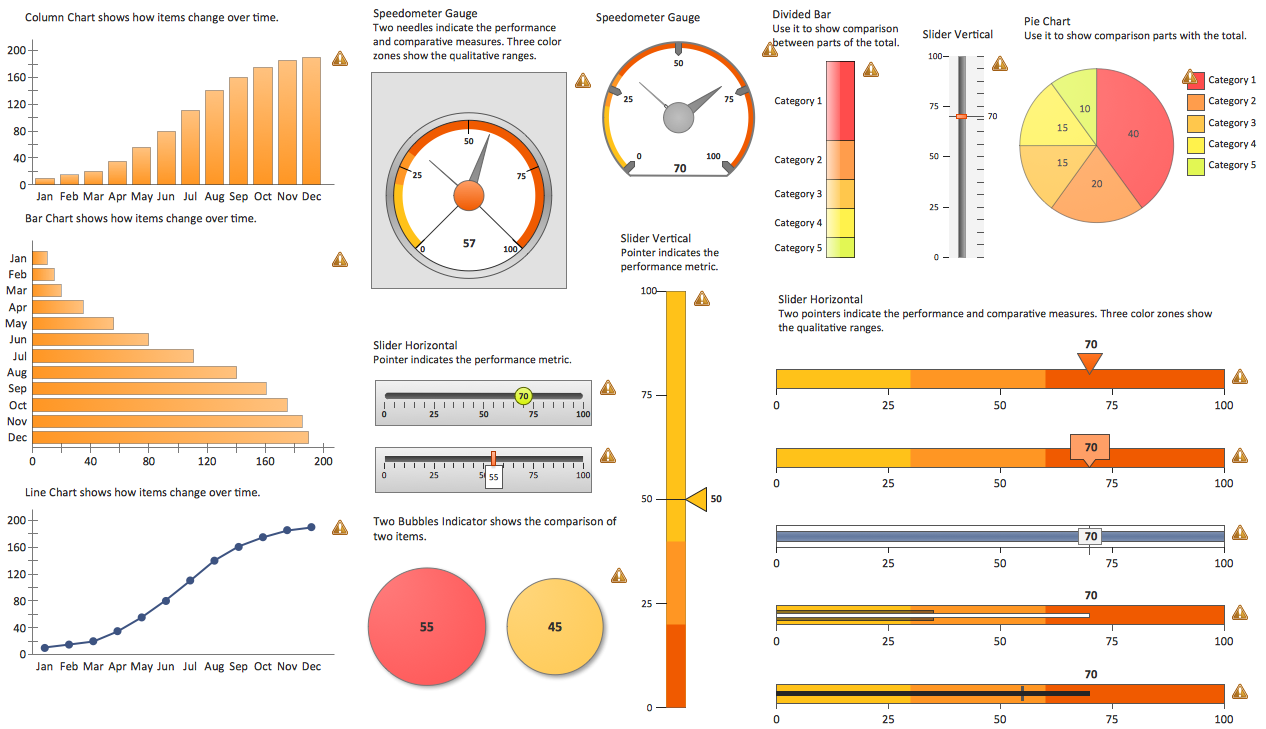
ConceptDraw Meter Dashboard solution is design to support creating interactive indicator such as Gauges, Meters, Bullets and Sliders. It is based on a Live Object technology. Live Meters indicators are used to show various types of quantitative data, and can be arranged into a dashboard. The dashboard displays the actual data from the data source files with regular updates every 5 seconds.Performance Indicators
ConceptDraw DIAGRAM diagramming and vector drawing software offers the useful tools of the Sales Dashboard solution from the Marketing area for easy creating professional looking live dashboards which allow to track the business sales activity and progress thanks to representing the Key Performance Indicators (KPIs) on them.Data Visualization Software Solutions
To see how your business can improve you can try data visualization software solutions that allows you visualize all your sales KPI in one sales dashboard allows you monitor and analyse sales activities.
 Sales Dashboard
Sales Dashboard solution extends ConceptDraw DIAGRAM software with templates, samples and library of vector stencils for drawing the visual dashboards of sale metrics and key performance indicators (KPI).
Visualize Sales Data Using Sample Data
ConceptDraw DIAGRAM software extended with the Sales Dashboard solution allows you visualize sales data using sample data delivered with the solution to choose visual indicators you need, and then connect these indicators to your real data.- Sales Dashboard | Gauge Chart Templates For Word Powerpoint Pdf
- Gauge Chart Templates For Word Powerpoint
- Speedometer Powerpoint Template Free
- Template Powerpoint Kpi
- Meter Dashboard | Sales Dashboard | Gauge Chart Templates For ...
- Free Dashboard Templates Powerpoint
- Gauge Chart In Excel
- Powerpoint Bar Chart Templates
- Powerpoint Dashboard Template
- Kpi Example Powerpoint Template
- Scorecard Template Powerpoint
- Dashboard Design Powerpoint Free Download
- Gauge Excel Template
- Chart Templates For Powerpoint
- Gauge Chart Templates
- KPI Dashboard | What is a KPI? | Sales KPI Dashboards | Ppt ...
- Balanced Scorecard Powerpoint Template
- Visualization Of Kpi Ppt
- Gauge Chart
- Network Topologies | How to Add a Rack Diagram to a PowerPoint ...
- ERD | Entity Relationship Diagrams, ERD Software for Mac and Win
- Flowchart | Basic Flowchart Symbols and Meaning
- Flowchart | Flowchart Design - Symbols, Shapes, Stencils and Icons
- Flowchart | Flow Chart Symbols
- Electrical | Electrical Drawing - Wiring and Circuits Schematics
- Flowchart | Common Flowchart Symbols
- Flowchart | Common Flowchart Symbols


