This site uses cookies. By continuing to browse the ConceptDraw site you are agreeing to our Use of Site Cookies.

How to Create Gantt Chart

To begin managing a new project, you will need to define the individual Tasks that must be completed to deliver it. The default view for a new project in ConceptDraw PROJECT is the Gantt Chart.

Gantt chart examples

All Gantt charts were made using ConceptDraw PROJECT. ConceptDraw PROJECT works both on Windows and Mac OS X. It allows to schedule a voluntary number of projects in a single Workspace document and lets easily share tasks and resources among them. ConceptDraw PROJECT shares files among Windows and Mac OS X.

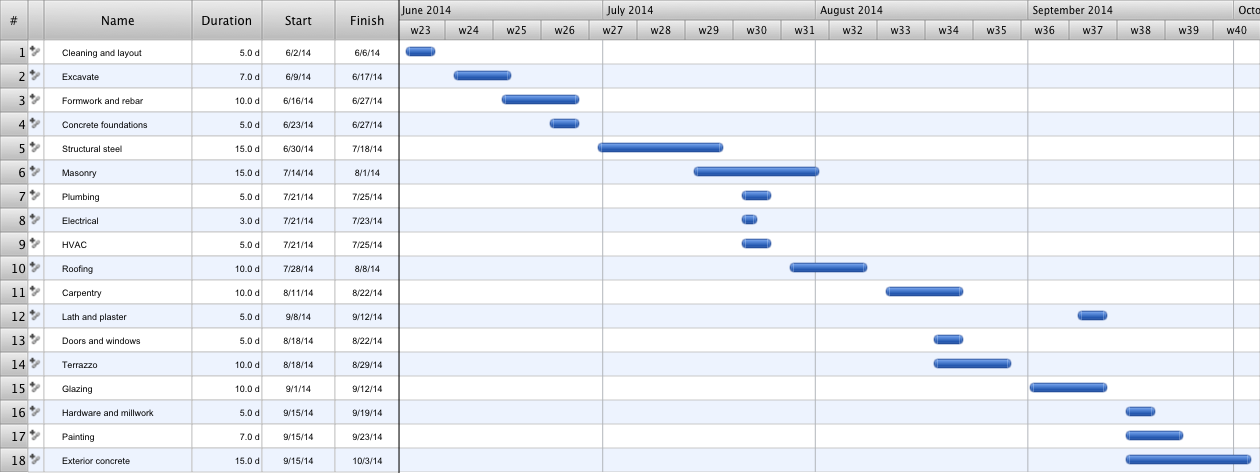
Gantt charts for planning and scheduling projects

Using Gantt chart software is perfect for planning, scheduling and monitoring project development or resource allocation. ConceptDraw is simple project scheduling software for reporting project statuses and maintaining gantt charts of milestones and tasks.

Gant Chart in Project Management

Gant Chart is a graphical representation of tasks as segments on a time scale. It helps plan and monitor project development or resource allocation. The horizontal axis is a time scale, expressed either in absolute or relative time.
what is software project management

How to Discover Critical Path on a Gantt Chart

ConceptDraw PROJECT is the Gantt chart software that implements critical path method to provide the user with a wide set of project management tools.

What is Gantt Chart (historical reference)

Historical reference about the Gantt chart.

Managing the task list

Four lessons explaining how to manage your task list in a Gantt chart. You will learn how to adjust your Gantt chart view, how to add/delete tasks or subtasks, how to change tasks hierarchy, how to show/hide subtasks.
HelpDesk

How to Draw a Gantt Chart

A Gantt chart is intended to provide a visualization of a project schedule. It is developed to help planning, coordinating, and tracking on project tasks implementation. One of the most critical resources for project implementation is a time resource. Gantt chart - is one of the most convenient and popular ways of graphical representation of project tasks progress in conjunction with the corresponding time consumption. Gantt chart's function is to show project tasks completed in a progress and to make a project manager sure that project tasks were completed on time. ConceptDraw OFFICE is a clear and easy-to-use tool for project management. It is a very handy visual tool that helps make a project processing clear.
HelpDesk

What Information to be Displayed in the ConceptDraw PROJECT Gantt Chart View

What information can can contain the project task list? Gantt Chart view is a graphical representation of a project outline that allows one to allocate tasks.You can customize a project’s tasks list view to include the columns you need to meet your information requirements. The columns of the ConceptDraw PROJECT Gantt view contain the information you want to capture about each task in your project. The following article details what information can be contained in the columns of a project outline.

Construction Project Chart Examples

ConceptDraw PROJECT provides a set of construction Gantt chart examples. Project manager requires task tracking, and project examples best approach to start. Make your project applying one of our ready-made examples.