HelpDesk
How to Create a Gantt Chart for Your Project
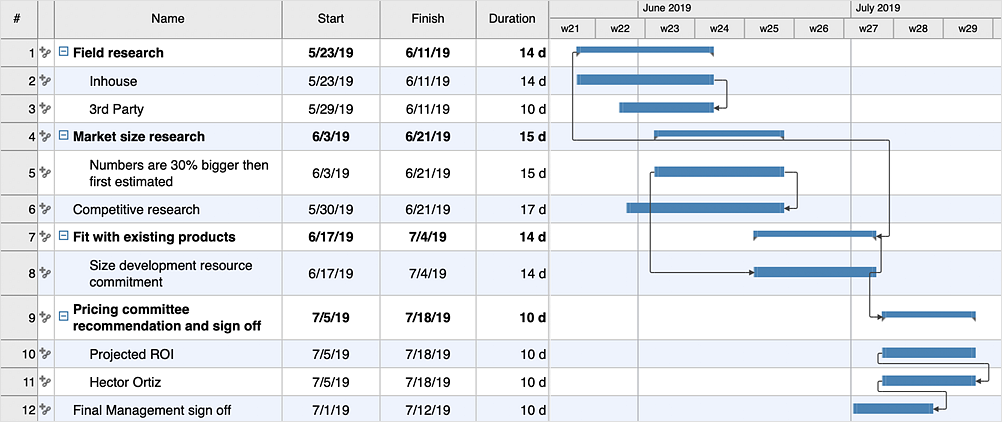
Instruction on how to create Gantt chart using ConceptDraw PROJECT software.Gant Chart is a graphical representation of tasks as segments on a time scale. It helps plan or overlapping.
 Business Processes
Business Process solution extends ConceptDraw DIAGRAM software with business process diagrams as cross-functional flowcharts, workflows, process charts, IDEF0, timelines, calendars, Gantt charts, business process modeling, audit and opportunity flowcharts.
HelpDesk
How to Track Your Project Plan vs. the Actual Project Condition
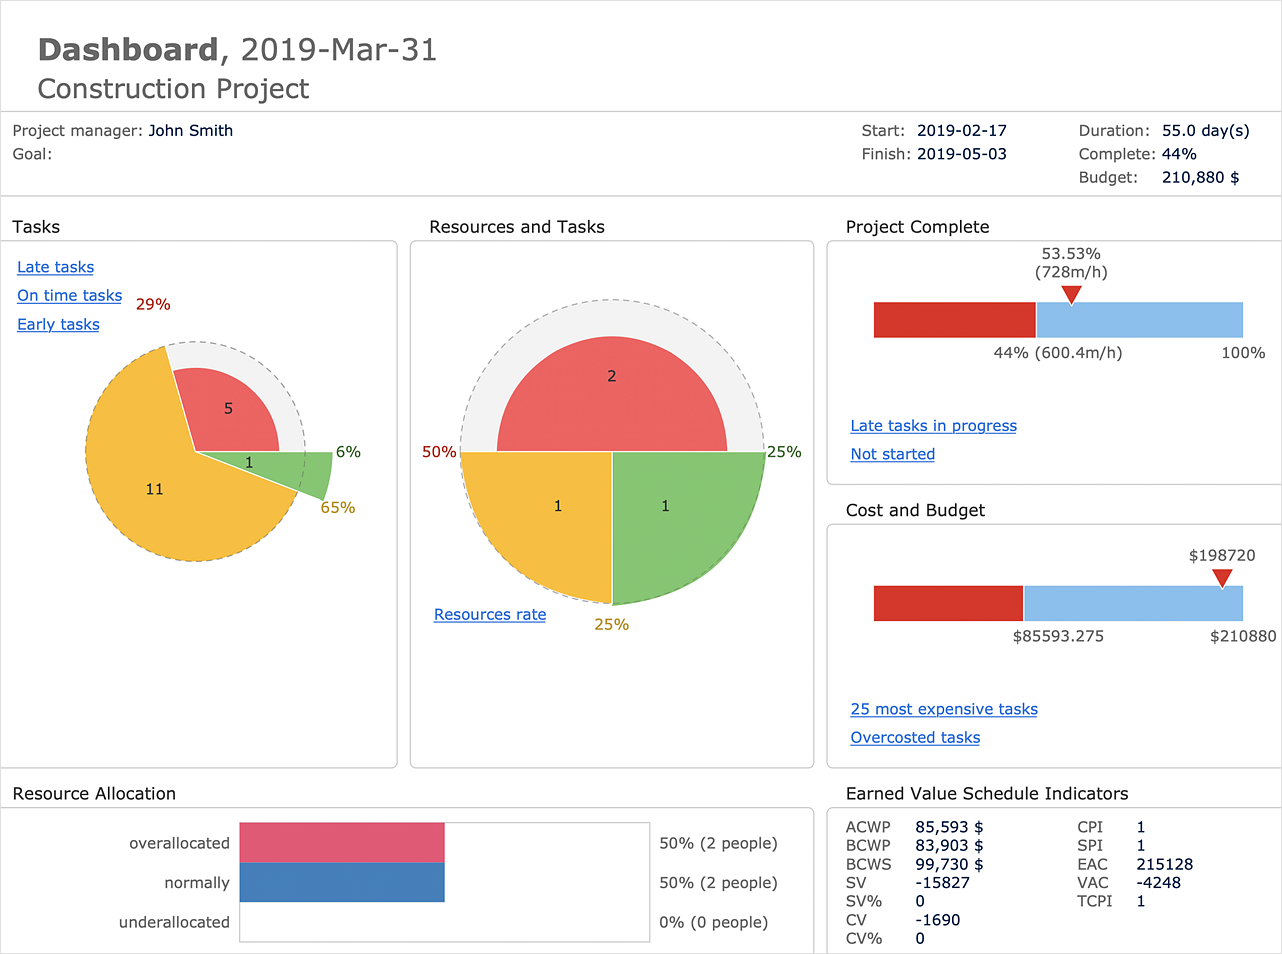
ConceptDraw PROJECT allows following how the project is going. You can easily compare the actual project data with the planned ones. The best tool for effective tracking of the project execution is to compare real data with the project baseline. It consists of the baseline start, baseline finish and baseline cost. Along with Baseline tracking ConceptDraw PROJECT offers several types of visual reports that can help to assess visually the difference between planned and actual project data.HelpDesk
How to Draw a Gantt Chart
A Gantt chart is intended to provide a visualization of a project schedule. It is developed to help planning, coordinating, and tracking on project tasks implementation. One of the most critical resources for project implementation is a time resource. Gantt chart - is one of the most convenient and popular ways of graphical representation of project tasks progress in conjunction with the corresponding time consumption. Gantt chart's function is to show project tasks completed in a progress and to make a project manager sure that project tasks were completed on time. ConceptDraw OFFICE is a clear and easy-to-use tool for project management. It is a very handy visual tool that helps make a project processing clear.Business diagrams & Org Charts with ConceptDraw DIAGRAM
Business flowcharting tool helps you create a flowchart with minimal effort. With ConceptDraw you can make a flowchart, draw data flow diagrams, orgchart professional, process flow diagrams etc - without any prior knowledge or training.
- Difference Between Timeline And Gantt Chart
- Different Between Gantt Chart And Timelines
- Difference Between Gantt Chart And Process Flow Chart
- Difference Between Gantt Chart And Timeline Chart
- Gantt charts for planning and scheduling projects | Project Timeline ...
- How to Make a Timeline | How to Track Your Project Plan vs . the ...
- Project Timeline | Gant Chart in Project Management | Timeline ...
- How to Track Your Project Plan vs . the Actual Project Condition | PM ...
- How to Discover Critical Path on a Gantt Chart | Program Evaluation ...
- Difference Between Pert And Gantt Chart
- Gant Chart in Project Management | Project Timeline | Project ...
- Drawing A Timeline In Business Process Mapping
- Project Timeline | Timeline Diagrams | Gantt Chart Software ...
- Project plan timeline - Request for proposal (RFP) | Activity Network ...
- Gant Chart in Project Management | How to Create a Timeline ...
- Gantt Chart Software | Recruitment | Make Historical Timeline
- How to Report Task's Execution with Gantt Chart | PM Easy | How to ...
- Process Flowchart | Differentiate Gantt Chart From Timeline
- Gantt Chart Software | Product Overview | Process Flowchart ...
- Project Timeline Chart
- ERD | Entity Relationship Diagrams, ERD Software for Mac and Win
- Flowchart | Basic Flowchart Symbols and Meaning
- Flowchart | Flowchart Design - Symbols, Shapes, Stencils and Icons
- Flowchart | Flow Chart Symbols
- Electrical | Electrical Drawing - Wiring and Circuits Schematics
- Flowchart | Common Flowchart Symbols
- Flowchart | Common Flowchart Symbols


