Gant Chart in Project Management


Gantt chart examples

How to Create Presentation of Your Project Gantt Chart

Gantt charts for planning and scheduling projects

HelpDesk
How to Create a Gantt Chart for Your Project

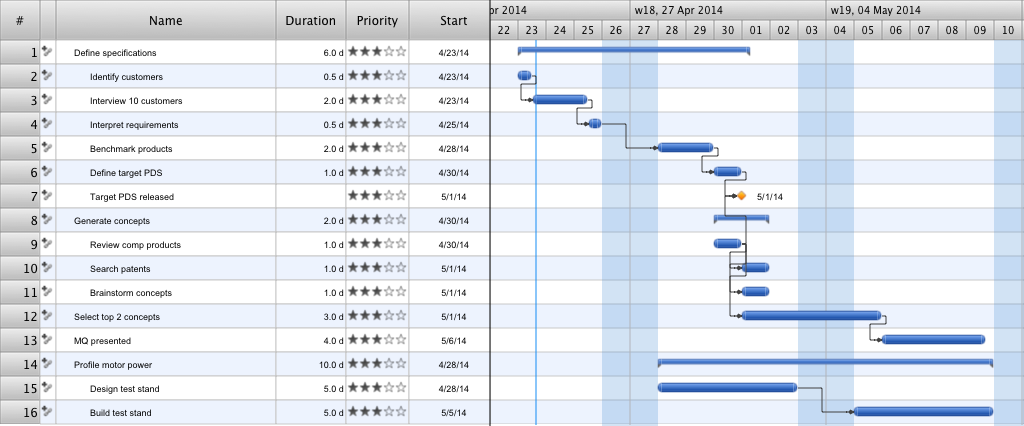
Gant Chart is a graphical representation of tasks as segments on a time scale. It helps plan or overlapping.
How to Discover Critical Path on a Gantt Chart

What is Gantt Chart (historical reference)

Gantt Chart Software

ConceptDraw PROJECT provides wide capabilities of importing and exporting in various formats: Microsoft Project, ConceptDraw MINDMAP , Mindjet MindManager, PDF file.
Gantt Chart Templates
ConceptDraw PROJECT lets you the useful possibility to create visual project dashboards and diagrams, generate various kinds of reports with one click. It provides also extensive capabilities of importing and exporting in various formats: Microsoft Project, ConceptDraw MINDMAP , Mindjet MindManager, PDF file.
How to Create Gantt Chart

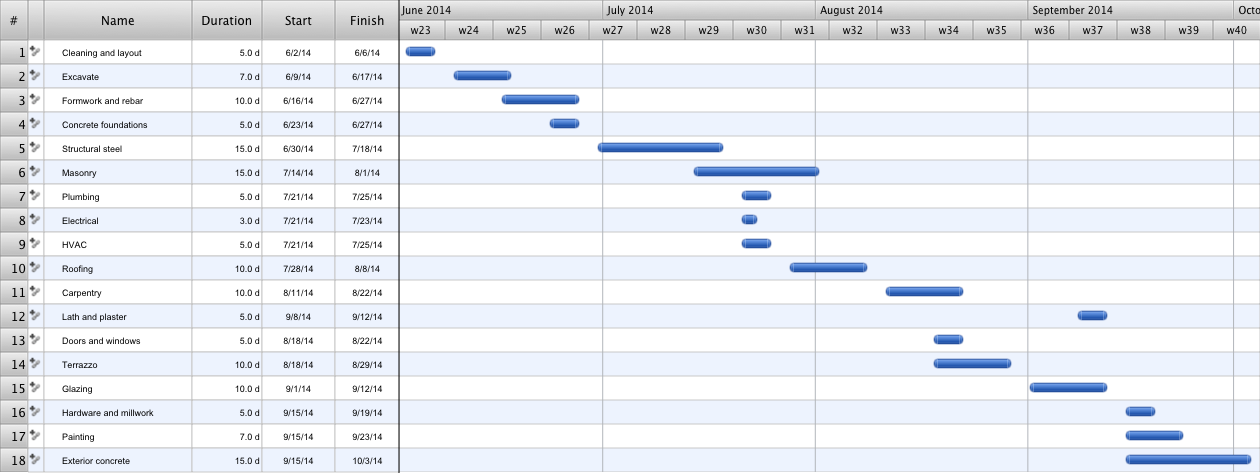
Construction Project Chart Examples
How to Report Task's Execution with Gantt Chart

Gantt Chart Software

Examples of Flowcharts, Org Charts and More


ConceptDraw PROJECT Project Management Software Tool

What Constitutes a Project?

PERT Chart Software

ConceptDraw DIAGRAM is a powerful diagramming and vector drawing software for designing professional looking PERT Charts quick and easy.
HelpDesk
How to Create Project Diagrams on PC

How To Plan and Implement Projects Faster

"Project planning is part of project management, which relates to the use of schedules such as Gantt charts to plan and subsequently report progress within the project environment.
Initially, the project scope is defined and the appropriate methods for completing the project are determined. Following this step, the durations for the various tasks necessary to complete the work are listed and grouped into a work breakdown structure. Project planning is often used to organize different areas of a project, including project plans, work loads and the management of teams and individuals. The logical dependencies between tasks are defined using an activity network diagram that enables identification of the critical path. Float or slack time in the schedule can be calculated using project management software. Then the necessary resources can be estimated and costs for each activity can be allocated to each resource, giving the total project cost. At this stage, the project schedule may be optimized to achieve the appropriate balance between resource usage and project duration to comply with the project objectives. Once established and agreed, the project schedule becomes what is known as the baseline schedule. Progress will be measured against the baseline schedule throughout the life of the project. Analyzing progress compared to the baseline schedule is known as earned value management.
The inputs of the project planning phase include the project charter and the concept proposal. The outputs of the project planning phase include the project requirements, the project schedule, and the project management plan." [Project planning. Wikipedia]
The flow chart example "Project planning process" was created using the ConceptDraw PRO diagramming and vector drawing software extended with the Flowcharts solution from the area "What is a Diagram" of ConceptDraw Solution Park.
Flowchart - Project planning process

- Gantt charts for planning and scheduling projects | Gant Chart in ...
- How to Draw an Organization Chart | Pie Chart Examples and ...
- How to Report Task's Execution with Gantt Chart | How to Create ...
- How to Draw a Gantt Chart Using ConceptDraw PRO | Gantt chart ...
- Gant Chart in Project Management | Project Timeline | How to ...
- Gantt chart examples | How To Plan and Implement Projects Faster ...
- Gant Chart in Project Management | Gantt charts for planning and ...
- Gantt charts for planning and scheduling projects | Examples of ...
- PM Easy | Business Processes | Gantt charts for planning and ...
- Gantt chart examples | Examples of Flowcharts, Org Charts and ...
- Gantt Chart And Pert Chart In Software Engineering With Example
- What is Gantt Chart (historical reference) | Gantt charts for planning ...
- Gant Chart in Project Management | Gantt charts for planning and ...
- Gant Chart in Project Management | What Constitutes a Project ...
- Gant Chart in Project Management | Gantt charts for planning and ...
- Construction Project Chart Examples | Gantt chart examples ...
- Gantt chart examples | Project — Working With Costs | How To Plan ...
- Gantt charts for planning and scheduling projects | Gantt chart ...
- Gant Chart in Project Management | What is Gantt Chart (historical ...
- Project — Working With Costs | Gant Chart in Project Management ...
- ERD | Entity Relationship Diagrams, ERD Software for Mac and Win
- Flowchart | Basic Flowchart Symbols and Meaning
- Flowchart | Flowchart Design - Symbols, Shapes, Stencils and Icons
- Flowchart | Flow Chart Symbols
- Electrical | Electrical Drawing - Wiring and Circuits Schematics
- Flowchart | Common Flowchart Symbols
- Flowchart | Common Flowchart Symbols