Gant Chart in Project Management


How to Discover Critical Path on a Gantt Chart

SWOT Matrix Template

Successful Strategic Plan

How to Create Presentation of Your Project Gantt Chart

Computer Hardware - Reseller Business Plan

Activity Network (PERT) Chart

This diagram is constructed as part of the process in creating a schedule of corrective actions. The Activity Network Chart (PERT) shows the logical connections and consequence of tasks to be performed. It displays the time period for problem solving and the implementation of all activities through the critical path.
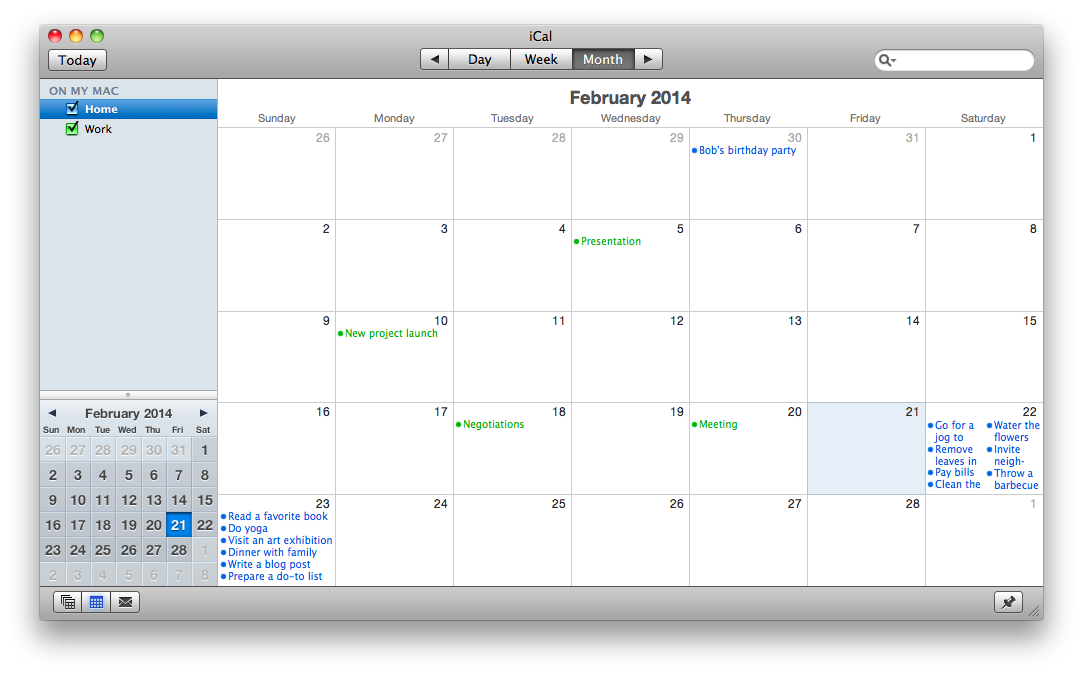
Export from ConceptDraw MINDMAP to Apple iCal
Feature Comparison Chart Software

This sample shows the Feature Comparison Chart of the digital scouting cameras. It can be useful for digital cameras production field, marketing, sales, etc.
Marketing and Sales Organization chart. Organization chart Example

This sample shows the Organizational Chart that displays the Sales and marketing (CRM) module. Using the ready-to-use predesigned objects, samples and templates from the Organizational Charts Solution for ConceptDraw DIAGRAM you can create your own orgchart professional quick and easy.
Activity Network Diagram Method

This sample shows the PERT (Program Evaluation Review Technique) chart of the request on proposal. A request for proposal (RFP) is a request of the company or the organization to potential suppliers to submit the business proposals for service or goods that it is interested to purchase. The RFP is represented on the initial procurement stage and allows to define the risks and benefits.
PERT Chart Software

ConceptDraw DIAGRAM is a powerful diagramming and vector drawing software for designing professional looking PERT Charts quick and easy.
Project —Task Trees and Dependencies

Remote Projects in Corporate Strategy


Affinity Diagram Software

Seven Management and Planning Tools solution from the Business Productivity area of ConceptDraw Solution Park provides templates, samples and ready-to-use vector stencils that will help you design the professional looking Affinity Diagrams in a few moments.
- Gantt Chart Table Matrix
- Gant Chart in Project Management | CORRECTIVE ACTIONS ...
- Matrix Organization Structure | 25 Typical Orgcharts | Gant Chart in ...
- Design elements - Tables | Gantt Chart Software | How to Create ...
- Gant Chart in Project Management | Ansoff's product / market matrix ...
- 25 Typical Orgcharts | Matrix Organization Structure | Gant Chart in ...
- Matrix Table Chart Sample
- Gant Chart in Project Management | SWOT Matrix Template | Human ...
- Gant Chart in Project Management | Marketing Analysis Diagram ...
- Chart Generator For Matrix Representation
- Competitor Analysis | Successful Strategic Plan | What is Gantt Chart ...
- Gant Chart in Project Management | SWOT Analysis | SWOT ...
- Organizational Structure | How to Report Task's Execution with Gantt ...
- Feature Comparison Chart Software | Competitive feature ...
- How to Draw a Matrix Organizational Chart with ConceptDraw PRO ...
- Successful Strategic Plan | What is Gantt Chart (historical reference ...
- SWOT matrix template | How to Create Presentation of Your Project ...
- SWOT Template | SWOT Analysis | SWOT Matrix Template ...
- How to Create Presentation of Your Project Gantt Chart | How to ...
- Schedule pie chart - Daily action plan | Pyramid Diagram | Gantt ...
- ERD | Entity Relationship Diagrams, ERD Software for Mac and Win
- Flowchart | Basic Flowchart Symbols and Meaning
- Flowchart | Flowchart Design - Symbols, Shapes, Stencils and Icons
- Flowchart | Flow Chart Symbols
- Electrical | Electrical Drawing - Wiring and Circuits Schematics
- Flowchart | Common Flowchart Symbols
- Flowchart | Common Flowchart Symbols