Gantt Chart Software

Project — Working With Costs

Product Overview

HelpDesk
What Information to be Displayed in the ConceptDraw PROJECT Gantt Chart View

HelpDesk
How to Customize Columns in Your Project Schedule

HelpDesk
How to Create a Gantt Chart for Your Project

Gant Chart is a graphical representation of tasks as segments on a time scale. It helps plan or overlapping.
HelpDesk
How to Plan and Allocate Resources with ConceptDraw PROJECT on PC

Managing the task list

HelpDesk
How to Generate Tabular Reports in ConceptDraw PROJECT for macOS

HelpDesk
How to Set a Project Baseline

HelpDesk
How to Use ConceptDraw PROJECT Micro Reports

HelpDesk
How to Export Project Data to MS Excel Worksheet

 PM Planning
The PM Planning solution extends the functional abilities of ConceptDraw MINDMAP and ConceptDraw PROJECT software, allowing to automatically create the spreadsheets reflecting the tasks and project statuses for people who have different project roles. The reporting capabilities of this solution are represented by the possibility to generate a wide range of project reports that allow the project managers, senior management and other project participants to be informed on a project daily progress and monthly objectives: All Inclusive Report, All Visible Columns, Milestones with Notes and Objectives, Projects Goals, Projects Managers, Project Team, and Top Level Tasks. The PM Planning solution from ConceptDraw Solution Park is a strong project management and productivity tool which simplifies the process of reporting and lets one create a document with the desired report, includes the predesigned examples, extends and improves the planning capabilities for all team members, improves the project communication, helps to accurately plan, maintain, and finish projects on time, to track the work of project resources, to perform the analytical work and to make effective decisions.
HelpDesk
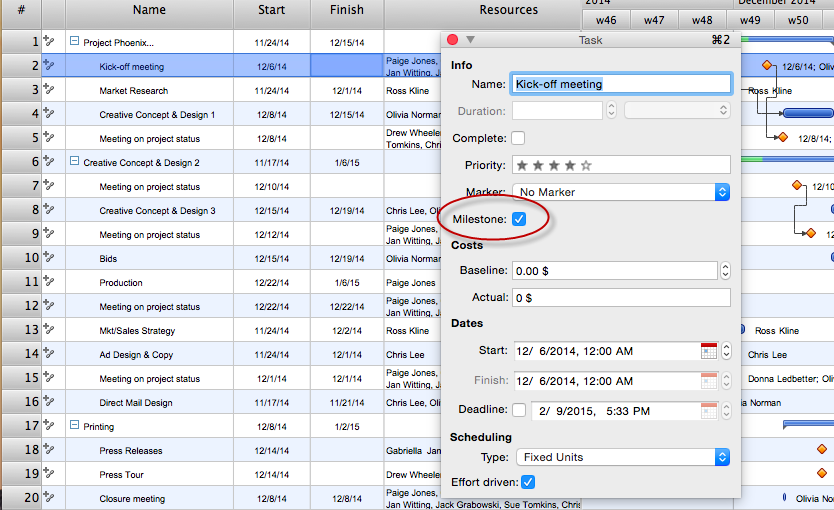
How to Identify Project Milestones
HelpDesk
How to Track Your Project Plan vs. the Actual Project Condition

HelpDesk
How to Shift Dates in ConceptDraw PROJECT

Business diagrams & Org Charts with ConceptDraw DIAGRAM


"Project planning is part of project management, which relates to the use of schedules such as Gantt charts to plan and subsequently report progress within the project environment.
Initially, the project scope is defined and the appropriate methods for completing the project are determined. Following this step, the durations for the various tasks necessary to complete the work are listed and grouped into a work breakdown structure. Project planning is often used to organize different areas of a project, including project plans, work loads and the management of teams and individuals. The logical dependencies between tasks are defined using an activity network diagram that enables identification of the critical path. Float or slack time in the schedule can be calculated using project management software. Then the necessary resources can be estimated and costs for each activity can be allocated to each resource, giving the total project cost. At this stage, the project schedule may be optimized to achieve the appropriate balance between resource usage and project duration to comply with the project objectives. Once established and agreed, the project schedule becomes what is known as the baseline schedule. Progress will be measured against the baseline schedule throughout the life of the project. Analyzing progress compared to the baseline schedule is known as earned value management.
The inputs of the project planning phase include the project charter and the concept proposal. The outputs of the project planning phase include the project requirements, the project schedule, and the project management plan." [Project planning. Wikipedia]
The flow chart example "Project planning process" was created using the ConceptDraw PRO diagramming and vector drawing software extended with the Flowcharts solution from the area "What is a Diagram" of ConceptDraw Solution Park.
Flowchart - Project planning process

HelpDesk
How are Summary Values of Project Phases Calculated

Collaboration in a Project Team

- Project — Working With Costs | Gantt Chart Software | Business ...
- How to Report Task's Execution with Gantt Chart | How to Create ...
- Status Dashboard | PM Dashboards | Project tasks dashboard ...
- How To Create Project Report | Business Intelligence Dashboard ...
- Project — Working With Costs | Gant Chart in Project Management ...
- How to Report Task's Execution with Gantt Chart ... - Conceptdraw.com
- Project — Working With Costs | Gantt Chart Software | What ...
- Project management task status dashboard | Project —Task Trees ...
- Gant Chart in Project Management | Gantt chart examples | How to ...
- Gant Chart in Project Management | Gantt charts for planning and ...
- Activity Network (PERT) Chart | CORRECTIVE ACTIONS PLANNING ...
- Gantt chart examples | Software development with ConceptDraw ...
- How to Report Task's Execution with Gantt Chart | How to Create ...
- Gantt chart examples | How To Plan and Implement Projects Faster ...
- How To Export Gantt Chart Concept Draw
- Gant Chart in Project Management | Gantt chart examples | Gantt ...
- PM Dashboards | Status Dashboard | Project tasks dashboard ...
- PM Dashboards | Status Dashboard | Project tasks dashboard | Free ...
- PM Dashboards | How to Create Project Dashboard on Mac | Status ...
- Gant Chart in Project Management | Gantt charts for planning and ...
- ERD | Entity Relationship Diagrams, ERD Software for Mac and Win
- Flowchart | Basic Flowchart Symbols and Meaning
- Flowchart | Flowchart Design - Symbols, Shapes, Stencils and Icons
- Flowchart | Flow Chart Symbols
- Electrical | Electrical Drawing - Wiring and Circuits Schematics
- Flowchart | Common Flowchart Symbols
- Flowchart | Common Flowchart Symbols