Gantt chart examples

Project — Working With Costs

How to Create Gantt Chart

How To Plan and Implement Projects Faster

Project —Task Trees and Dependencies

Gantt charts for planning and scheduling projects

Gantt Chart Software

ConceptDraw PROJECT provides wide capabilities of importing and exporting in various formats: Microsoft Project, ConceptDraw MINDMAP , Mindjet MindManager, PDF file.
What is Gantt Chart (historical reference)

ConceptDraw PROJECT Software Overview

Looking at ConceptDraw MINDMAP as a Replacement for Mindjet Mindmanager

Economical. (Lower license price, support is no charge maintenance is an optional one-time fee that delivers to you the next major release) ConceptDraw products are structured to save you money from the date of purchase for the life of the product. When you compare ConceptDraw MINDMAP to Mindjet Mindmanager the cost savings will be obvious.
Flexible Licensing. ConceptDraw is licensed per-named-user. Want ConceptDraw on 2 PCs, 2 Macs, or a PC and a Mac? Straightforward licensing makes this easy.
UML Activity Diagram

Use ConceptDraw DIAGRAM diagramming and vector drawing software enhanced with Rapid UML solution from ConceptDraw Solution Park to create your own UML activity diagrams that show the business and operational workflows of components and overall flow of control in your systems. Such software provides coloring UML diagrams for various purposes and simplifying work of the engineers.
Ishikawa Diagram

ConceptDraw DIAGRAM diagramming and vector drawing software extended with Fishbone Diagrams solution from the Management area can help you with construction the Fishbone Diagram also known as Ishikawa Diagram.
Ishikawa Diagram shows factors of Equipment, Process, People, Materials, Environment and Management, all affecting the overall problem in one drawing for the further analysis. It is a well effective way to analyze the business problems you must identify and solve.
Pyramid Diagram and Pyramid Chart

How To Use Collaboration Tool in Project Management

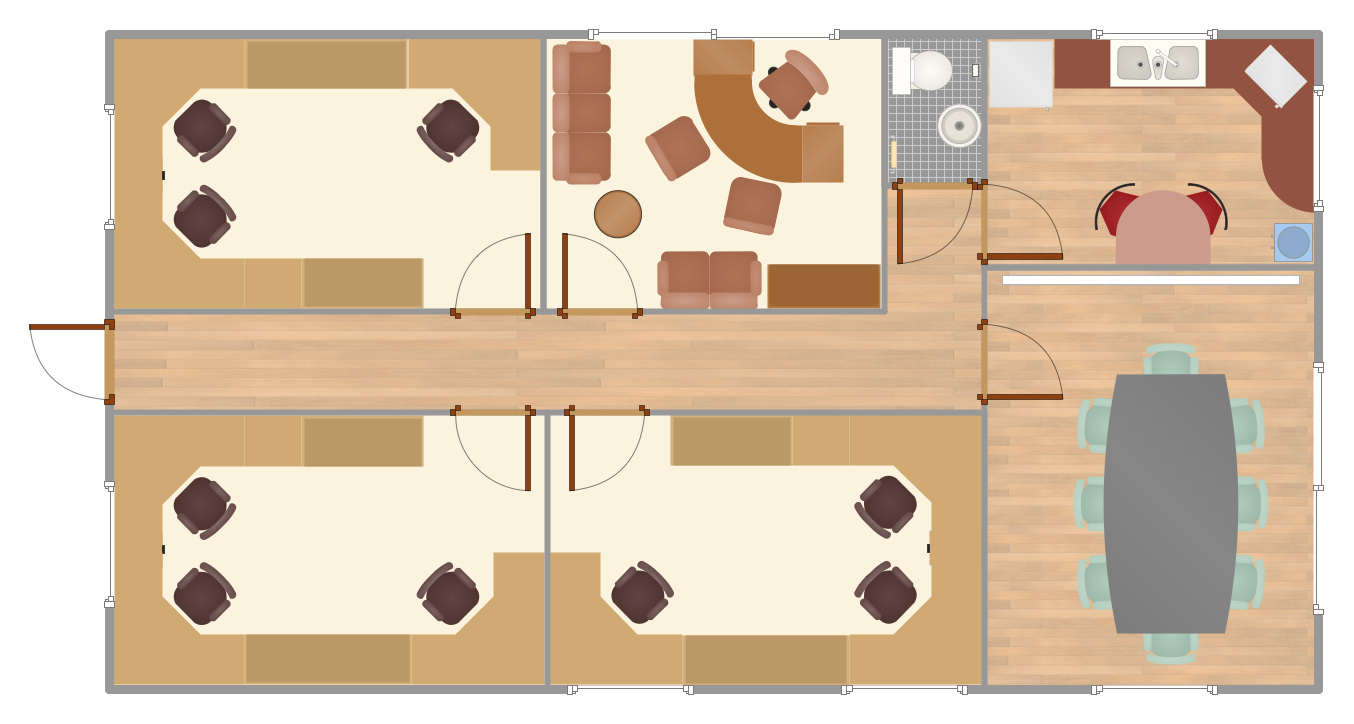
Office Floor Plans
- Usefulness Of Gantt Chart In Launching A New Product
- How to Create Presentation of Your Project Gantt Chart | How To ...
- Gantt Chart Product Launch
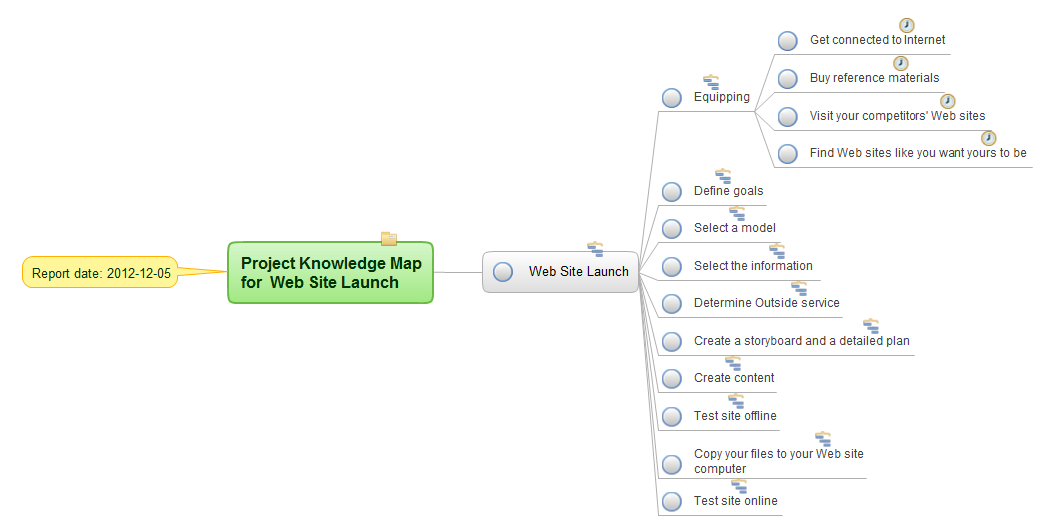
- Gantt chart examples | How To Plan and Implement Projects Faster ...
- How to Report Task's Execution with Gantt Chart | Project ...
- Gantt Chart Business Plan Product Launch
- Gantt Chart For Product Sampling
- Gantt Chart Software | Project — Working With Costs | Product ...
- Organizational Chart For Launching New Project
- Gant Chart in Project Management | Gantt chart examples | Gantt ...
- Product Launch Example Charts
- Gantts Chart To Launch A New Product
- New Product Launch Project Management
- Product Launch Project Plan Ms
- ConceptDraw Arrows10 Technology | | Wbs Sample Product Launch
- How To Plan and Implement Projects Faster | Gant Chart in Project ...
- Gantt chart examples | Gant Chart in Project Management | Example ...
- Flow Chart For Product Launch
- Project — Working With Costs | | Sample Timeline New Product ...
- Project — Working With Costs | Gantt Chart Software | What ...
- ERD | Entity Relationship Diagrams, ERD Software for Mac and Win
- Flowchart | Basic Flowchart Symbols and Meaning
- Flowchart | Flowchart Design - Symbols, Shapes, Stencils and Icons
- Flowchart | Flow Chart Symbols
- Electrical | Electrical Drawing - Wiring and Circuits Schematics
- Flowchart | Common Flowchart Symbols
- Flowchart | Common Flowchart Symbols