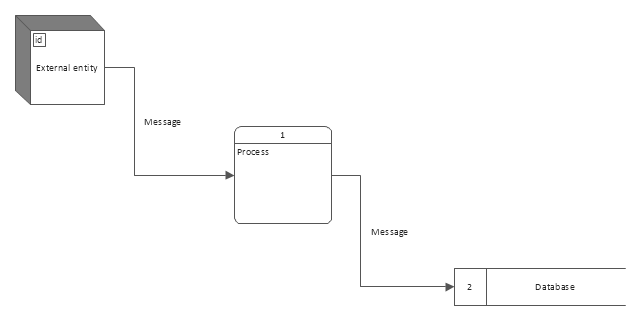
Gane Sarson Diagram

Creando Diagramas

Data Flow Diagram Symbols. DFD Library

Use this template to create your data flow diagrams (DFD) by Gane-Sarson (DFD) notation using the ConceptDraw PRO diagramming and vector drawing software extended with the Data Flow Diagrams solution from the Software Development area of ConceptDraw Solution Park.
DFD template
Data Flow Diagram Software

ConceptDraw DIAGRAM is a powerful Data Flow Diagram Software thanks to the Data Flow Diagrams solution from the Software Development area of ConceptDraw Solution Park.
You can use the predesigned DFD vector objects that are grouped in 3 libraries of Data Flow Diagrams solution: Data Flow Diagrams Library; Gane-Sarson Notation Library; Yourdon and Coad Notation Library.
SDL Diagram

This sample shows the SDL Diagram of the process game.
SWOT Sample in Computers

Diagramming Software for Design UML Interaction Overview Diagrams


Business and Finance Illustrations Example

Structured Systems Analysis and Design Method. SSADM with ConceptDraw DIAGRAM

How to Make a Timeline

Data Flow Diagram Examples

Design Data Flow. DFD Library

Data Flow Diagram Model

Swim Lanes

ConceptDraw DIAGRAM diagramming and vector drawing software extended with Business Process Mapping Solution from the Business Processes Area of ConceptDraw Solution Park is ideal for drawing Business Process Maps and Swim Lanes Flowcharts.
Scrum

Agile Methodology

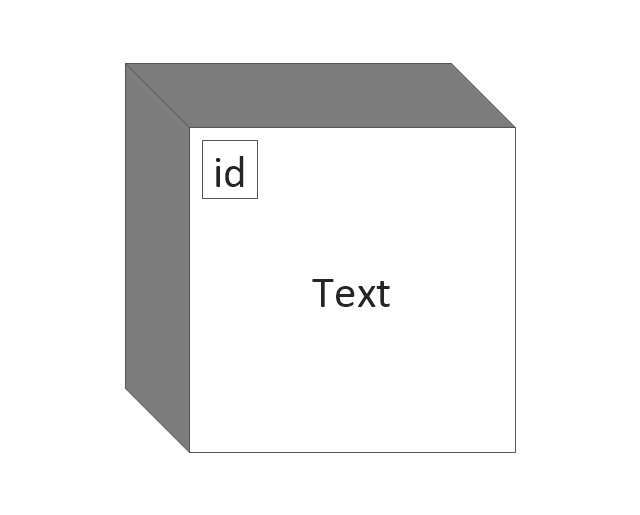
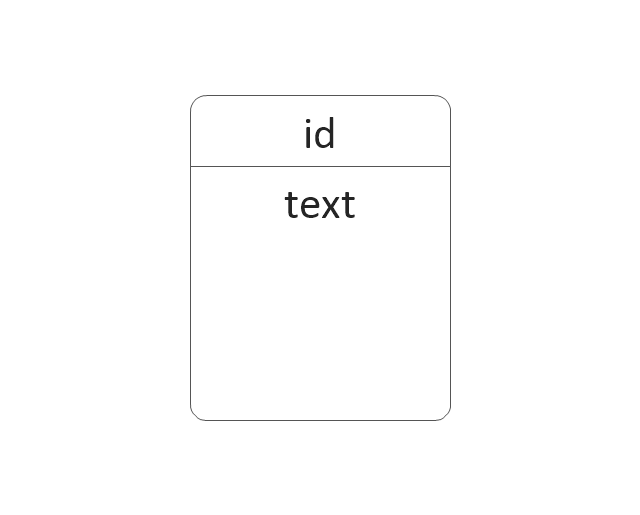
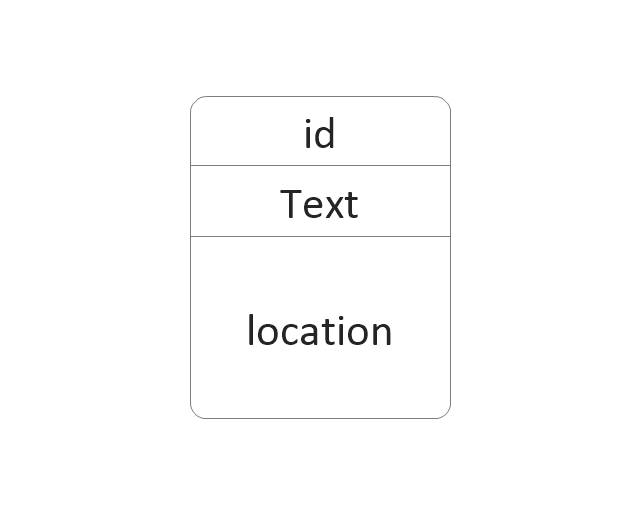
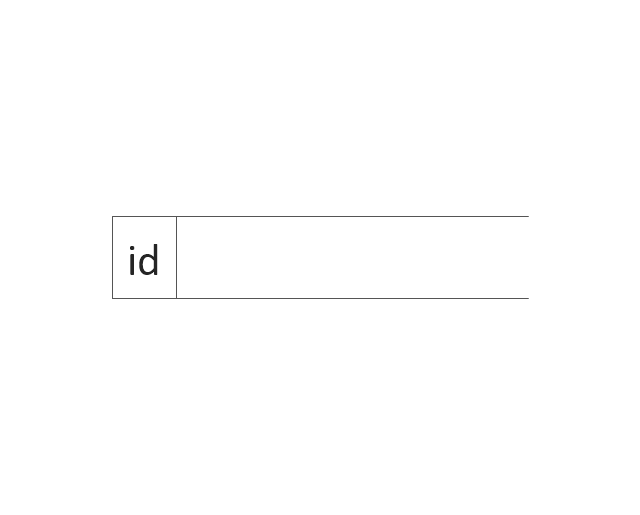
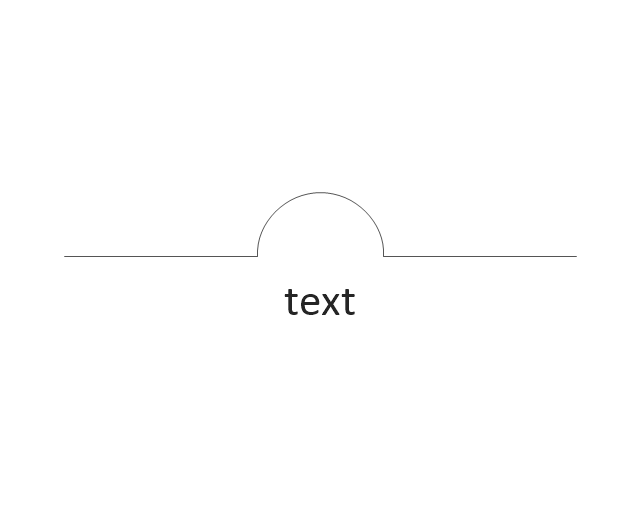
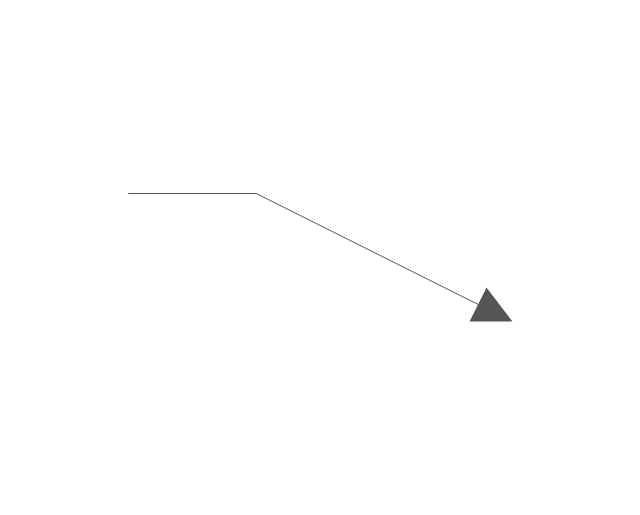
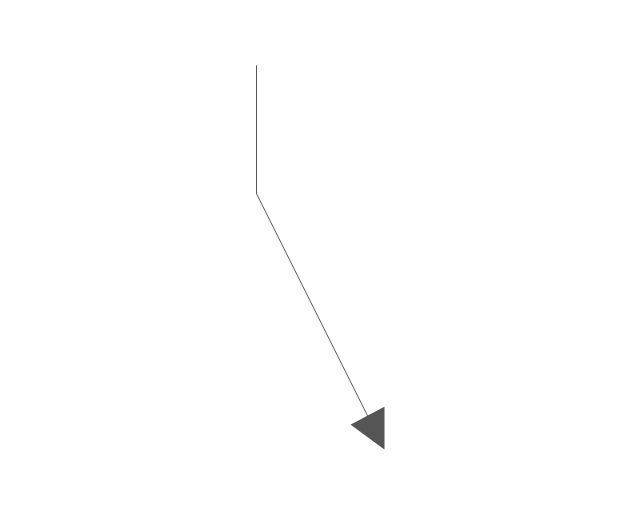
The vector stencils library "DFD, Gane-Sarson notation" contains 12 DFD elements.
Use it for drawing data flow diagrams (DFD) using Gane-Sarson notation in the ConceptDraw PRO diagramming and vector drawing software extended with the Data Flow Diagrams solution from the Software Development area of ConceptDraw Solution Park.
Use it for drawing data flow diagrams (DFD) using Gane-Sarson notation in the ConceptDraw PRO diagramming and vector drawing software extended with the Data Flow Diagrams solution from the Software Development area of ConceptDraw Solution Park.
External Entity
Process
Process w / Location
Data Store
Jump
Angled Connector
Angled Connector 2
Top to Bottom Variable
Bottom to Side
Side to Side
Side to Same Side
Top to Top Side
UML Use Case Diagram Example. Registration System

This sample was created in ConceptDraw DIAGRAM diagramming and vector drawing software using the UML Use Case Diagram library of the Rapid UML Solution from the Software Development area of ConceptDraw Solution Park.
This sample shows the types of user’s interactions with the system and is used at the registration and working with the database system.
Software Diagram Examples and Templates

Software Development area of ConceptDraw Solution Park provides 5 solutions:
Data Flow Diagrams, Entity-Relationship Diagram (ERD), Graphic User Interface, IDEFO Diagrams, Rapid UML.
- Gane Sarson Diagram | DFD, Gane - Sarson notation - Template ...
- Gane Sarson Diagram | Structured Systems Analysis and Design ...
- Entity-Relationship Diagram (ERD) | Gane Sarson Diagram | Circle ...
- Gane Sarson Diagram | Data Flow Diagram Symbols. DFD Library ...
- DFD, Gane - Sarson notation - Vector stencils library | Gane Sarson ...
- Gane Sarson Diagram | Online Flow Chart | Property Management ...
- Gane Sarson Diagram | Basic Flowchart Symbols and Meaning ...
- Gane Sarson Diagram | Describe Gene And Sarson Symbols
- DFD, Gane - Sarson notation - Vector stencils library | Diagram Of ...
- DFD, Gane - Sarson notation - Vector stencils library | DFD, Gane ...
- Gane Sarson Diagram | Yed Flowchart Tutorial
- Gane Sarson Diagram | eLearning for Skype | Explain About Gene ...
- Program to Make Flow Chart | Gane Sarson Diagram | Scrum ...
- Data Flow Diagrams (DFD) | Process Oriented Design By Gane ...
- Gane Sarson Diagram | Types of Flowcharts | Describe The Gane ...
- DFD, Gane - Sarson notation - Template
- Gane Sarson Diagram | Hiring process workflow | Swim Lane ...
- SWOT Sample in Computers | Gane Sarson Diagram | Diagramming ...
- Gane Sarson Diagram | Data Flow Diagram | Program Evaluation ...
- Gane Sarson Diagram | Seven Basic Tools of Quality — Quality ...
- ERD | Entity Relationship Diagrams, ERD Software for Mac and Win
- Flowchart | Basic Flowchart Symbols and Meaning
- Flowchart | Flowchart Design - Symbols, Shapes, Stencils and Icons
- Flowchart | Flow Chart Symbols
- Electrical | Electrical Drawing - Wiring and Circuits Schematics
- Flowchart | Common Flowchart Symbols
- Flowchart | Common Flowchart Symbols