 Block Diagrams
Block diagrams solution extends ConceptDraw PRO software with templates, samples and libraries of vector stencils for drawing the block diagrams.
HelpDesk
How to Create a Functional Flow Block Diagram

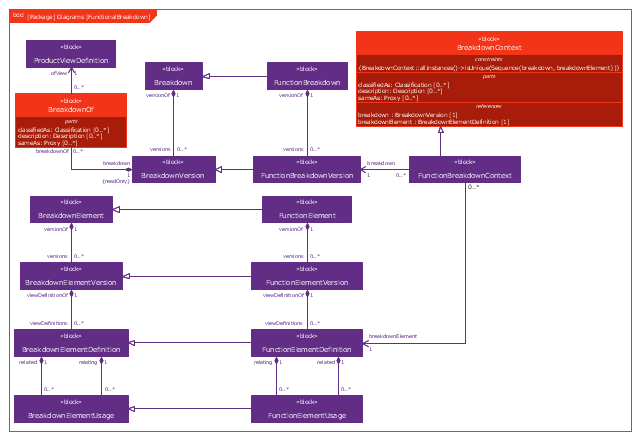
This example was drawn on the base of figure 1 on the webpage "Template: OASIS:FunctionalBreakdownStructure" from the OASIS website.
"The FunctionalBreakdownStructure template describes how to represent a relationship between a FunctionalElementDefinition and another FunctionalElementDefinition that is a constituent.
The SysML Block Definition diagram in Figure 1 shows how a functional breakdown is represented in the PLCS PSM."
[docs.oasis-open.org/ plcs/ plcslib/ v1.0/ csprd01/ data/ contexts/ OASIS/ templates/ FunctionalBreakdownStructure/ template.html]
"A block definition diagram is based on the UML class diagram, with restrictions and extensions as defined by SysML." [omg.org/ spec/ SysML/ 1.3/ PDF]
The example "SysML block definition diagram - Function Breakdown model" was drawn using the ConceptDraw PRO diagramming and vector drawing software extended with the SysML solution from the Software Development area of ConceptDraw Solution Park.
Example of SysML BDD
HelpDesk
How to Draw a Block Diagram in ConceptDraw PRO

HelpDesk
How to Add a Block Diagram to a MS Word ™ Document Using ConceptDraw PRO

 IDEF0 Diagrams
IDEF0 Diagrams visualize system models using the Integration Definition for Function Modeling (IDEF) methodology. Use them for analysis, development and integration of information and software systems, and business process modelling.
- Function Model Block Diagram
- Function Model Diagram Template
- Function Block Diagram Library
- Function Block Diagram For Information System
- Block Diagram Of Function Organization Management
- Function Model Diagram Templates
- Functional Block Diagram | Basic Flowchart Symbols and Meaning ...
- Function Of Management Block Diagram
- Finance Functions Block Diagram
- Functional Block Diagram
- Business Function Diagram
- Functional Block Diagram | How to Create a Functional Flow Block ...
- Function Organization Structure Block Diagram
- UML Block Diagram | Block Diagrams | Functional Block Diagram ...
- Function Structure Diagram And Function Block Diagram
- Functional Block Diagram | Block Diagrams | Cross-Functional ...
- Functional Block Diagram | Process Flowchart | Block Diagram ...
- Block Diagrams | Block Diagram Software | Process Flowchart ...
- Explain The Functions Of The Block Diagram Of A Simple
- Basic Diagramming | Block Diagram Creator | Create Block Diagram ...
- ERD | Entity Relationship Diagrams, ERD Software for Mac and Win
- Flowchart | Basic Flowchart Symbols and Meaning
- Flowchart | Flowchart Design - Symbols, Shapes, Stencils and Icons
- Flowchart | Flow Chart Symbols
- Electrical | Electrical Drawing - Wiring and Circuits Schematics
- Flowchart | Common Flowchart Symbols
- Flowchart | Common Flowchart Symbols