Flowchart Software

ConceptDraw DIAGRAM flowchart software will help to quickly create new flowcharts, workflow, NS Diagram, BPMN Diagram, Cross-functional flowcharts, data flow diagrams and highlight flowcharts.
Feature-rich flowchart maker, free thousand flowchart examples and templates and colored symbols that will allow you to create professional looking flowcharts simply.
ConceptDraw DIAGRAM supports macOS and Windows.

How To Create a Flow Chart in ConceptDraw

Put an initial object from library to a page and use RapidDraw technology clicking on direction arrows to add new objects to the flowchart. This way you can make flowchart quickly.
Flowchart Software

How to Draw a Flowchart

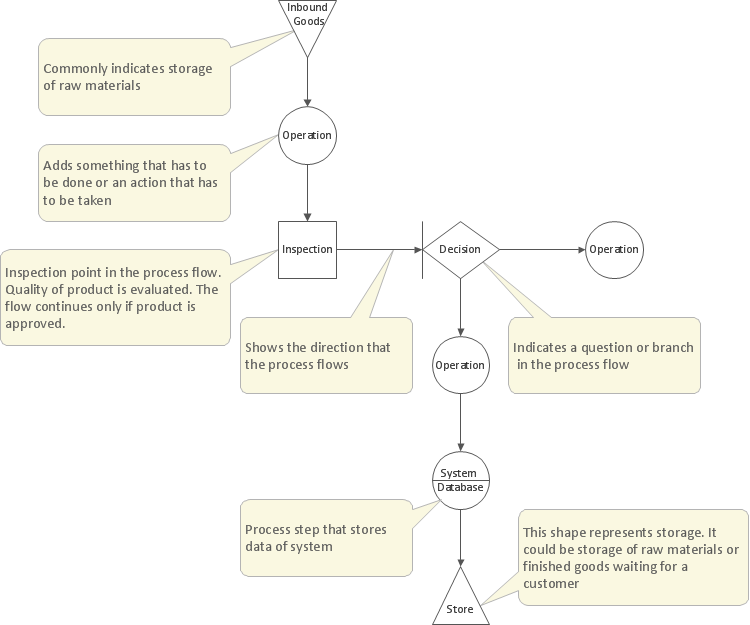
Although there are many symbols that can be used in flowcharts to represent different kinds of steps, accurate flowcharts can be created using very few (e.g. Process, Decision, Start, delay, cloud).
Create TQM Flowcharts for Mac
Selecting & Creating Flowcharts

How to Create a Process Flowchart

Create Graphs and Charts

Create Flow Chart on Mac

Extended flowchart maker features of Rapid Draw functionality was developed to create flow chart on the Mac OS X platform. You will save time by quick and simple flowchart maker due to Rapid Draw.
The Best Flowchart Software Available

ConceptDraw DIAGRAM vector diagramming and business graphics software enhanced with with templates, green and interactive flowchart makers, samples and stencil libraries from ConceptDraw Solution Park which all focused to help with drawing flowcharts, block diagrams, bar charts, histograms, pie charts, divided bar diagrams, line graphs, area charts, scatter plots, circular arrows diagrams, Venn diagrams, bubble diagrams, concept maps, and others.

- Free Editable Flowchart Template Mac
- Flow Chart Template For Mac Free
- Process Flow Template Excel Free
- Swimlane Flowchart Template Excel
- Flowchart Mac Free
- Editable Fishbone Diagram
- Process Mapping Template Free Download Mac
- Free Swim Lane Diagram Template Excel
- Flowchart Software | Fishbone Diagram Xls
- Risk diagram (PDPC) - Template | Free Excel Decision Tree ...
- ERD | Entity Relationship Diagrams, ERD Software for Mac and Win
- Flowchart | Basic Flowchart Symbols and Meaning
- Flowchart | Flowchart Design - Symbols, Shapes, Stencils and Icons
- Flowchart | Flow Chart Symbols
- Electrical | Electrical Drawing - Wiring and Circuits Schematics
- Flowchart | Common Flowchart Symbols
- Flowchart | Common Flowchart Symbols