Organizational Chart Template

Organizational Chart Templates

Use the Organizational Charts Solution for ConceptDraw DIAGRAM to create your own Organizational Charts of any complexity quick, easy and effective.
The Organizational Charts designed with ConceptDraw DIAGRAM are vector graphic documents and are available for reviewing, modifying, converting to a variety of formats (image, HTML, PDF file, MS PowerPoint Presentation, Adobe Flash or MS Visio XML), printing and send via e-mail in one moment.

Flowchart Software

ConceptDraw DIAGRAM flowchart software will help to quickly create new flowcharts, workflow, NS Diagram, BPMN Diagram, Cross-functional flowcharts, data flow diagrams and highlight flowcharts.
Feature-rich flowchart maker, free thousand flowchart examples and templates and colored symbols that will allow you to create professional looking flowcharts simply.
ConceptDraw DIAGRAM supports macOS and Windows.

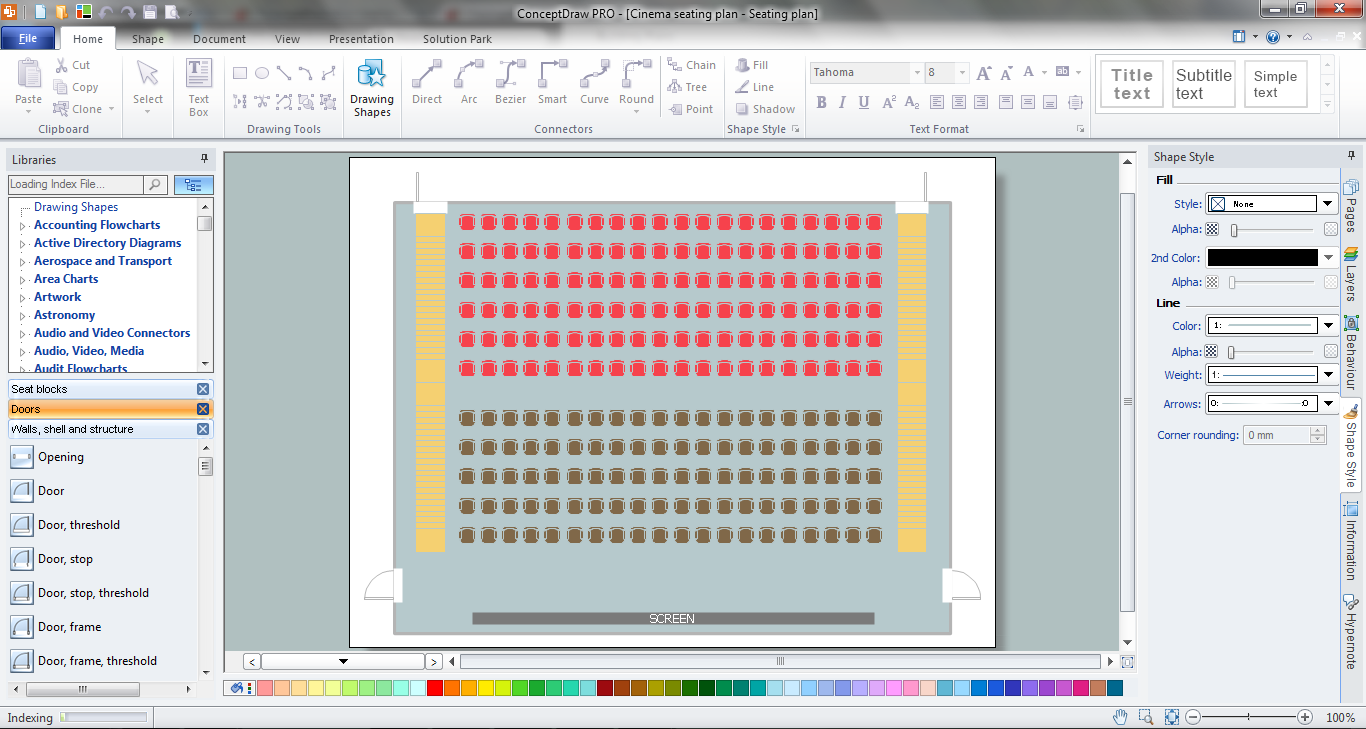
Seating Chart Template Free
Pie Chart Word Template. Pie Chart Examples

Line Chart Template for Word

This sample shows the Line Chart of annual percentage change. The Line Chart allows you to clearly see the changes of data over the time.
Bar Chart Template for Word

You can quickly rework these bar graph templates into your own charts by simply changing displayed data, title and legend texts.
Donut Chart Templates

All these donut chart templates are included in the Pie Charts solution.
You can quickly rework these examples into your own charts by simply changing displayed data, title and legend texts.
Chart Templates

Spider Chart Template

Flowchart Software

The Flowcharts diagrams are widely used for designing, documenting, analyzing and managing the complex processes and programs in various fields such as business, engineering, architecture, science, manufacturing, administration, etc.
Pyramid Diagram and Pyramid Chart

Pie Chart Examples and Templates

Pie chart examples and templates created using ConceptDraw DIAGRAM software helps you get closer with pie charts and find pie chart examples suite your needs.
Column Chart Template

- Free Line Graph Templates
- Seating Chart Template Free | Seating Plans | Table Seating Chart ...
- Line Chart Template for Word | Chart Maker for Presentations | Chart ...
- Seating Plans | Seating Chart Template Free | Table Seating Chart ...
- Process Mapping Template Free Download Mac
- Free Flow Business Strategy Chart Template
- Free Sample Business Structure Flowchart Templates
- Flowchart Software | Process Flowchart | Bar Chart Template for ...
- Free Mac Fill In Bubble Chart Template
- Organizational Chart Template
- Organizational Chart Template | ConceptDraw PRO - Organizational ...
- Free Fill In Bubble Chart Template For Mac
- Free Comparison Matrix Template
- Create Graphs and Charts | Selecting & Creating Flowcharts ...
- Pie Donut Chart . Pie Chart Examples | Donut Chart Templates ...
- Organizational Chart Template
- Business Flow Chart Template Free
- Free Ppt Sample Templates With Graphs And Charts
- Sports Seating Chart Maker Free
- Organization Chart Free Download
- ERD | Entity Relationship Diagrams, ERD Software for Mac and Win
- Flowchart | Basic Flowchart Symbols and Meaning
- Flowchart | Flowchart Design - Symbols, Shapes, Stencils and Icons
- Flowchart | Flow Chart Symbols
- Electrical | Electrical Drawing - Wiring and Circuits Schematics
- Flowchart | Common Flowchart Symbols
- Flowchart | Common Flowchart Symbols