This work flow chart sample was redesigned from the picture "Weather Forecast" from the article "Simulation Workflows".
[iaas.uni-stuttgart.de/ forschung/ projects/ simtech/ sim-workflows.php]
"(1) The weather is predicted for a particular geological area. Hence, the workflow is fed with a model of the geophysical environment of ground, air and water for a requested area.
(2) Over a specified period of time (e.g. 6 hours) several different variables are measured and observed. Ground stations, ships, airplanes, weather balloons, satellites and buoys measure the air pressure, air/ water temperature, wind velocity, air humidity, vertical temperature profiles, cloud velocity, rain fall, and more.
(3) This data needs to be collected from the different sources and stored for later access.
(4) The collected data is analyzed and transformed into a common format (e.g. Fahrenheit to Celsius scale). The normalized values are used to create the current state of the atmosphere.
(5) Then, a numerical weather forecast is made based on mathematical-physical models (e.g. GFS - Global Forecast System, UKMO - United Kingdom MOdel, GME - global model of Deutscher Wetterdienst). The environmental area needs to be discretized beforehand using grid cells. The physical parameters measured in Step 2 are exposed in 3D space as timely function. This leads to a system of partial differential equations reflecting the physical relations that is solved numerically.
(6) The results of the numerical models are complemented with a statistical interpretation (e.g. with MOS - Model-Output-Statistics). That means the forecast result of the numerical models is compared to statistical weather data. Known forecast failures are corrected.
(7) The numerical post-processing is done with DMO (Direct Model Output): the numerical results are interpolated for specific geological locations.
(8) Additionally, a statistical post-processing step removes failures of measuring devices (e.g. using KALMAN filters).
(9) The statistical interpretation and the numerical results are then observed and interpreted by meteorologists based on their subjective experiences.
(10) Finally, the weather forecast is visualized and presented to interested people." [iaas.uni-stuttgart.de/ forschung/ projects/ simtech/ sim-workflows.php]
The example "Workflow diagram - Weather forecast" was drawn using the ConceptDraw PRO diagramming and vector drawing software extended with the Workflow Diagrams solution from the Business Processes area of ConceptDraw Solution Park.
Work flow chart

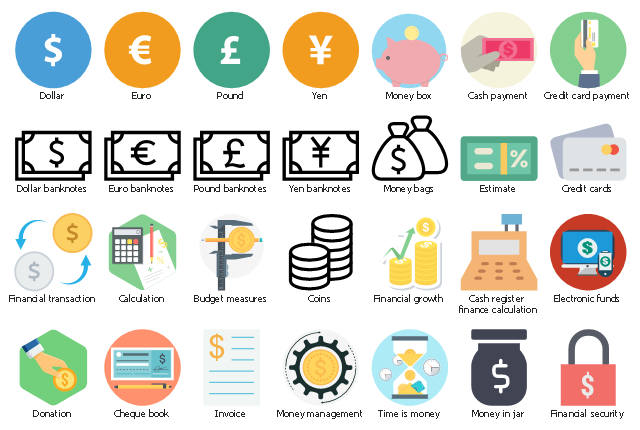
The vector stencils library "Money" contains 19 clipart images and idiograms of money for drawing financial and business illustrations, presentations, infographics and web pages.
"Money is any object or verifiable record that is generally accepted as payment for goods and services and repayment of debts in a particular country or socio-economic context. The main functions of money are distinguished as: a medium of exchange; a unit of account; a store of value; and, occasionally in the past, a standard of deferred payment. Any kind of object or verifiable record that fulfills these functions can be considered money.
Money is historically an emergent market phenomenon establishing a commodity money, but nearly all contemporary money systems are based on fiat money. Fiat money, like any check or note of debt, is without intrinsic use value as a physical commodity. It derives its value by being declared by a government to be legal tender; that is, it must be accepted as a form of payment within the boundaries of the country, for "all debts, public and private". Such laws in practice cause fiat money to acquire the value of any of the goods and services that it may be traded for within the nation that issues it.
The money supply of a country consists of currency (banknotes and coins) and usually includes bank money (the balance held in checking accounts and savings accounts). Bank money, which consists only of records (mostly computerized in modern banking), forms by far the largest part of broad money in developed countries." [Money. Wikipedia]
The clip art example "Money - Vector stencils library" was created using the ConceptDraw PRO software extended with the Business and Finance solution from the Illustration area of ConceptDraw Solution Park.
www.conceptdraw.com/ solution-park/ illustrations-business-finance
Credit card

Money-box 1

Money-box 2

Time is money

Money bag

Cash

Coins

Credit card payment

Cash counting machine

Calculation of revenue

Forecasting of the increase

Financial transaction

Success or failure of the financial transaction

Cash payment

Electronic transfer

Cheque book

Postal order

Securities

Money in glassy jar

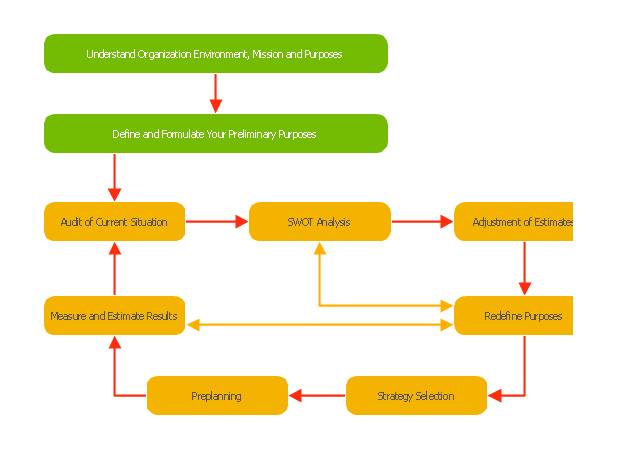
"Planning (also called forethought) is the process of thinking about and organizing the activities required to achieve a desired goal.
Planning involves the creation and maintenance of a plan. As such, planning is a fundamental property of intelligent behavior. This thought process is essential to the creation and refinement of a plan, or integration of it with other plans; that is, it combines forecasting of developments with the preparation of scenarios of how to react to them.
An important, albeit often ignored aspect of planning, is the relationship it holds with forecasting. Forecasting can be described as predicting what the future will look like, whereas planning predicts what the future should look like. The counterpart to planning is spontaneous order." [Planning. Wikipedia]
The block diagram example "Planning process" was created using the ConceptDraw PRO diagramming and vector drawing software extended with the Block Diagrams solution from the area "What is a Diagram" of ConceptDraw Solution Park.
Block diagram
The vector stencils library "Money" contains 19 clipart images and idiograms of money for drawing financial and business illustrations, presentations, infographics and web pages.
"Money is any object or verifiable record that is generally accepted as payment for goods and services and repayment of debts in a particular country or socio-economic context. The main functions of money are distinguished as: a medium of exchange; a unit of account; a store of value; and, occasionally in the past, a standard of deferred payment. Any kind of object or verifiable record that fulfills these functions can be considered money.
Money is historically an emergent market phenomenon establishing a commodity money, but nearly all contemporary money systems are based on fiat money. Fiat money, like any check or note of debt, is without intrinsic use value as a physical commodity. It derives its value by being declared by a government to be legal tender; that is, it must be accepted as a form of payment within the boundaries of the country, for "all debts, public and private". Such laws in practice cause fiat money to acquire the value of any of the goods and services that it may be traded for within the nation that issues it.
The money supply of a country consists of currency (banknotes and coins) and usually includes bank money (the balance held in checking accounts and savings accounts). Bank money, which consists only of records (mostly computerized in modern banking), forms by far the largest part of broad money in developed countries." [Money. Wikipedia]
The clip art example "Money - Vector stencils library" was created using the ConceptDraw PRO software extended with the Business and Finance solution from the Illustration area of ConceptDraw Solution Park.
www.conceptdraw.com/ solution-park/ illustrations-business-finance
"Money is any object or verifiable record that is generally accepted as payment for goods and services and repayment of debts in a particular country or socio-economic context. The main functions of money are distinguished as: a medium of exchange; a unit of account; a store of value; and, occasionally in the past, a standard of deferred payment. Any kind of object or verifiable record that fulfills these functions can be considered money.
Money is historically an emergent market phenomenon establishing a commodity money, but nearly all contemporary money systems are based on fiat money. Fiat money, like any check or note of debt, is without intrinsic use value as a physical commodity. It derives its value by being declared by a government to be legal tender; that is, it must be accepted as a form of payment within the boundaries of the country, for "all debts, public and private". Such laws in practice cause fiat money to acquire the value of any of the goods and services that it may be traded for within the nation that issues it.
The money supply of a country consists of currency (banknotes and coins) and usually includes bank money (the balance held in checking accounts and savings accounts). Bank money, which consists only of records (mostly computerized in modern banking), forms by far the largest part of broad money in developed countries." [Money. Wikipedia]
The clip art example "Money - Vector stencils library" was created using the ConceptDraw PRO software extended with the Business and Finance solution from the Illustration area of ConceptDraw Solution Park.
www.conceptdraw.com/ solution-park/ illustrations-business-finance
Credit card
Money-box 1
Money-box 2
Time is money
Money bag
Cash
Coins
Credit card payment
Cash counting machine
Calculation of revenue
Forecasting of the increase
Financial transaction
Success or failure of the financial transaction
Cash payment
Electronic transfer
Cheque book
Postal order
Securities
Money in glassy jar
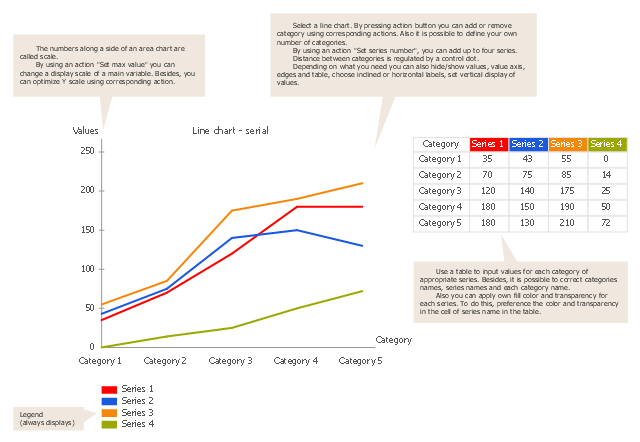
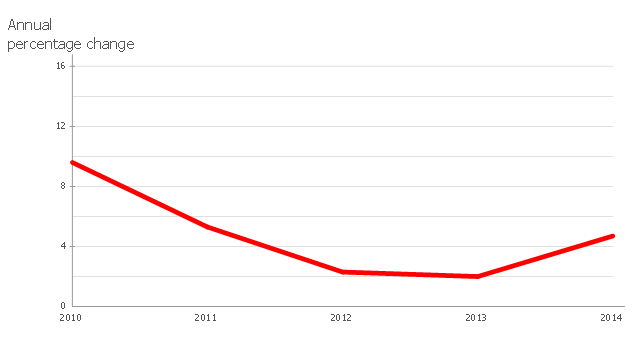
"A time series is a sequence of data points, measured typically at successive points in time spaced at uniform time intervals. ... Time series are very frequently plotted via line charts. Time series are used in statistics, signal processing, pattern recognition, econometrics, mathematical finance, weather forecasting, earthquake prediction, electroencephalography, control engineering, astronomy, and communications engineering. Time series analysis comprises methods for analyzing time series data in order to extract meaningful statistics and other characteristics of the data. Time series forecasting is the use of a model to predict future values based on previously observed values. While regression analysis is often employed in such a way as to test theories that the current values of one or more independent time series affect the current value of another time series, this type of analysis of time series is not called "time series analysis", which focuses on comparing values of time series at different points in time. Time series data have a natural temporal ordering." [Time series. Wikipedia]
The line graph template for the ConceptDraw PRO diagramming and vector drawing software is included in the Line Graphs solution from the Graphs and Charts area of ConceptDraw Solution Park.
The line graph template for the ConceptDraw PRO diagramming and vector drawing software is included in the Line Graphs solution from the Graphs and Charts area of ConceptDraw Solution Park.
Line chart template
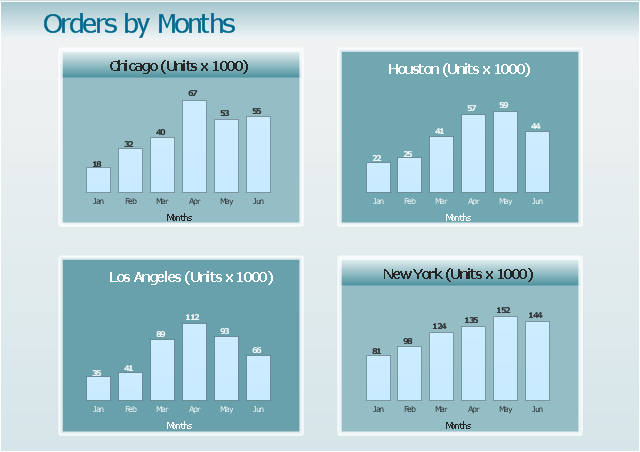
"A time series is a sequence of data points, measured typically at successive points in time spaced at uniform time intervals. ... Time series are very frequently plotted via line charts. Time series are used in statistics, signal processing, pattern recognition, econometrics, mathematical finance, weather forecasting, earthquake prediction, electroencephalography, control engineering, astronomy, and communications engineering.
Time series analysis comprises methods for analyzing time series data in order to extract meaningful statistics and other characteristics of the data. Time series forecasting is the use of a model to predict future values based on previously observed values." [Time series. Wikipedia]
The example "Orders by months - Time series dashboard" was created using the ConceptDraw PRO diagramming and vector drawing software extended with the Time Series Dashboard solution from the area "What is a Dashboard" of ConceptDraw Solution Park.
Order by months - Time series dashboard
Use the vector clipart libraries Currency and Money to quick draw illustrations, diagrams and infographics for your business and financial documents, presentations and websites.
The vector stencils library Currency contains 19 images: Euro, Euro coin, Dollar, Dollar coin, Pound, Pound coin, Yen, Yen coin, Dollars, Pounds, Coin.
The vector stencils library Money contains 19 images: Credit card, Money box, Time is money, Money bag, Cash, Coins, Credit card payment, Credit card, Payment, Cash counting machine, Calculation of revenue, Calculation, Revenue, Forecasting of the increase, Financial transaction, Success or failure of the financial transaction, Success, Failure, Financial transaction, Cash payment, Electronic transfer, Cheque book, Postal order, Securities, Money in glassy jar.
The clipart libraries Currency and Money are included in the Business and Finance solution from Illustration area of ConceptDraw Solution Park.
Vector clip art
Line Chart Template for Word

This sample shows the Line Chart of annual percentage change. The Line Chart allows you to clearly see the changes of data over the time.
Sales Process Flowchart Symbols

Competitor Analysis

Money - Design Elements

Various styles of money design elements (currency symbols, clipart, money symbols) can be found in ConceptDraw PRO Business and Finance Solution.
The line graph example "France exports of goods and services" depicts data from the European Economic Forecast (EUROPEAN ECONOMY 1|2013, Economic and Financial Affairs Winter 2013, European Commission)
[ec.europa.eu/ economy_ finance/ publications/ european_ economy/ 2013/ pdf/ ee1_ en.pdf].
"Exports in France decreased to 36526 EUR Million in October of 2013 from 36637 EUR Million in September of 2013. Exports in France is reported by the Ministère de l'Économie et des Finances. Exports in France averaged 17102.29 EUR Million from 1970 until 2013, reaching an all time high of 37964 EUR Million in August of 2012 and a record low of 1165.60 EUR Million in May of 1970. France is one of the largest exporters of luxury goods and agricultural products in the world. France main exports are: aircrafts (10.1 percent of total exports), food (9.7 percent), chemicals (9.5 percent), industrial machinery (8.3 percent), iron and steel (7.9 percent), electronics (6.7 percent), motor vehicles (6.3 percent) and pharmaceuticals (6.1 percent). Trade outflows to Europe account for 70 percent of total exports. Main export partners are: Germany (16.6 percent of total exports), Italy (8.2 percent), Spain (7.3 percent), Belgium (7.2 percent), the United Kingdom (6.6 percent), the United States (5.6 percent), Netherlands and China. This page contains - France Exports - actual values, historical data, forecast, chart, statistics, economic calendar and news." [tradingeconomics.com/ france/ exports]
The line graph example "France exports of goods and services" was created using ConceptDraw PRO diagramming and vector drawing software extended with Line Graphs solution from Graphs and Charts area of ConceptDraw Solution Park.
Line chart
Workflow Diagram Software

This flow chart sample was drawn on the base on the illustration of the article "Climate change impact on China food security in 2050" from the website of Chinese Academy of Agricultural Sciences .
[caas.cn/ en/ newsroom/ research_ update/ 67347.shtml]
"Food security is a condition related to the ongoing availability of food. ...
According to the Food and Agriculture Organization (FAO), food security "exists when all people, at all times, have physical and economic access to sufficient, safe and nutritious food to meet their dietary needs and food preferences for an active and healthy life". ...
Extreme events, such as droughts and floods, are forecast to increase as climate change takes hold. Ranging from overnight floods to gradually worsening droughts, these will have a range of impacts on the agricultural sector. ...
According to the Climate & Development Knowledge Network report Managing Climate Extremes and Disasters in the Agriculture Sectors: Lessons from the IPCC SREX Report, the impacts will include changing productivity and livelihood patterns, economic losses, and impacts on infrastructure, markets and food security. Food security in future will be linked to our ability to adapt agricultural systems to extreme events." [Food security. Wikipedia]
The flowchart example "Food security assessment" was created using the ConceptDraw PRO diagramming and vector drawing software extended with the Flowcharts solution from the area "What is a Diagram" of ConceptDraw Solution Park.
Flowchart

- Workflow diagram - Weather forecast | Contoh Flowchart | Types of ...
- Workflow diagram - Weather forecast | Line Chart Template for Word ...
- Workflow diagram - Weather forecast | Workflow Diagram Software ...
- Give A Diagram Of A Weather Forecasting
- Forecasting of the increase
- Block diagram - Planning process | Process Flowchart | Project ...
- Block diagram - Planning process | Block Diagrams | Block diagram ...
- Seven Management and Planning Tools | How To use Electrical and ...
- Workflow diagram - Weather forecast | How can you illustrate the ...
- Data Flow Daigram Weather Forecasting System Block Diagram
- Data Flow Daigram Report Forecasting
- Line graph template
- Block diagram - Planning process | Block Diagrams | Block Diagram ...
- Workflow diagram - Weather forecast | Six Markets Model Chart ...
- Workflow Diagram Symbols | Workflow diagram - Weather forecast ...
- Campus Area Networks (CAN). Computer and Network Examples ...
- Workflow diagram - Weather forecast
- Block diagram - Planning process | Process Flowchart | Process ...
- Basic Flowchart Symbols and Meaning | Workflow diagram ...
- Line Chart Template for Word | Line graph template - The number of ...
- ERD | Entity Relationship Diagrams, ERD Software for Mac and Win
- Flowchart | Basic Flowchart Symbols and Meaning
- Flowchart | Flowchart Design - Symbols, Shapes, Stencils and Icons
- Flowchart | Flow Chart Symbols
- Electrical | Electrical Drawing - Wiring and Circuits Schematics
- Flowchart | Common Flowchart Symbols
- Flowchart | Common Flowchart Symbols