This work flow chart sample was redesigned from the picture "Weather Forecast" from the article "Simulation Workflows".
[iaas.uni-stuttgart.de/ forschung/ projects/ simtech/ sim-workflows.php]
"(1) The weather is predicted for a particular geological area. Hence, the workflow is fed with a model of the geophysical environment of ground, air and water for a requested area.
(2) Over a specified period of time (e.g. 6 hours) several different variables are measured and observed. Ground stations, ships, airplanes, weather balloons, satellites and buoys measure the air pressure, air/ water temperature, wind velocity, air humidity, vertical temperature profiles, cloud velocity, rain fall, and more.
(3) This data needs to be collected from the different sources and stored for later access.
(4) The collected data is analyzed and transformed into a common format (e.g. Fahrenheit to Celsius scale). The normalized values are used to create the current state of the atmosphere.
(5) Then, a numerical weather forecast is made based on mathematical-physical models (e.g. GFS - Global Forecast System, UKMO - United Kingdom MOdel, GME - global model of Deutscher Wetterdienst). The environmental area needs to be discretized beforehand using grid cells. The physical parameters measured in Step 2 are exposed in 3D space as timely function. This leads to a system of partial differential equations reflecting the physical relations that is solved numerically.
(6) The results of the numerical models are complemented with a statistical interpretation (e.g. with MOS - Model-Output-Statistics). That means the forecast result of the numerical models is compared to statistical weather data. Known forecast failures are corrected.
(7) The numerical post-processing is done with DMO (Direct Model Output): the numerical results are interpolated for specific geological locations.
(8) Additionally, a statistical post-processing step removes failures of measuring devices (e.g. using KALMAN filters).
(9) The statistical interpretation and the numerical results are then observed and interpreted by meteorologists based on their subjective experiences.
(10) Finally, the weather forecast is visualized and presented to interested people." [iaas.uni-stuttgart.de/ forschung/ projects/ simtech/ sim-workflows.php]
The example "Workflow diagram - Weather forecast" was drawn using the ConceptDraw PRO diagramming and vector drawing software extended with the Workflow Diagrams solution from the Business Processes area of ConceptDraw Solution Park.
Work flow chart

The vector stencils library "Application" contains 40 icons of software applications.
Use it to design your computer and telecom illustrations and infographics with ConceptDraw PRO diagramming and vector drawing software.
The vector stencils library "Application" is included in the Computers and Communications solution from the Illustration area of ConceptDraw Solution Park.
Use it to design your computer and telecom illustrations and infographics with ConceptDraw PRO diagramming and vector drawing software.
The vector stencils library "Application" is included in the Computers and Communications solution from the Illustration area of ConceptDraw Solution Park.
Book

Lecture book

E-learning

Education

Graduate

A plus

Student

Position holder

Achievement

Diamond

Present

Balance scale

Law

Atom

Formula

Chemistry

Research

Measuring

Plan

Calendar

Notice pin

Appointment

Tea cup

Journal

Archive

Calculator

Text format

Graphic editor

Vector graphics

Digital art board

Creative

Design

Adaptive

ECG

Forecast book

Presentation

Shopping basket

Platform truck

Printer

Air conditioner

Computer Hardware - Reseller Business Plan

This line chart sample depicts data from the European Economic Forecast (EUROPEAN ECONOMY 1|2013, Economic and Financial Affairs Winter 2013, European Commission).
[ec.europa.eu/ economy_ finance/ publications/ european_ economy/ 2013/ pdf/ ee1_ en.pdf]
"Exports in France decreased to 36526 EUR Million in October of 2013 from 36637 EUR Million in September of 2013. Exports in France is reported by the Ministère de l'Économie et des Finances. Exports in France averaged 17102.29 EUR Million from 1970 until 2013, reaching an all time high of 37964 EUR Million in August of 2012 and a record low of 1165.60 EUR Million in May of 1970. France is one of the largest exporters of luxury goods and agricultural products in the world. France main exports are: aircrafts (10.1 percent of total exports), food (9.7 percent), chemicals (9.5 percent), industrial machinery (8.3 percent), iron and steel (7.9 percent), electronics (6.7 percent), motor vehicles (6.3 percent) and pharmaceuticals (6.1 percent). Trade outflows to Europe account for 70 percent of total exports. Main export partners are: Germany (16.6 percent of total exports), Italy (8.2 percent), Spain (7.3 percent), Belgium (7.2 percent), the United Kingdom (6.6 percent), the United States (5.6 percent), Netherlands and China. This page contains - France Exports - actual values, historical data, forecast, chart, statistics, economic calendar and news." [tradingeconomics.com/ france/ exports]
The line graph example "France exports of goods and services" was created using ConceptDraw PRO diagramming and vector drawing software extended with Line Graphs solution from Graphs and Charts area of ConceptDraw Solution Park.
Line chart

Workflow Diagram Software

Competitor Analysis

Sales Process Flowchart Symbols

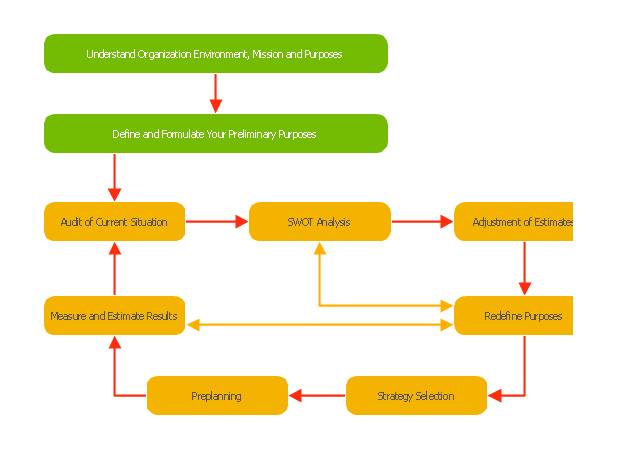
"Planning (also called forethought) is the process of thinking about and organizing the activities required to achieve a desired goal.
Planning involves the creation and maintenance of a plan. As such, planning is a fundamental property of intelligent behavior. This thought process is essential to the creation and refinement of a plan, or integration of it with other plans; that is, it combines forecasting of developments with the preparation of scenarios of how to react to them.
An important, albeit often ignored aspect of planning, is the relationship it holds with forecasting. Forecasting can be described as predicting what the future will look like, whereas planning predicts what the future should look like. The counterpart to planning is spontaneous order." [Planning. Wikipedia]
The block diagram example "Planning process" was created using the ConceptDraw PRO diagramming and vector drawing software extended with the Block Diagrams solution from the area "What is a Diagram" of ConceptDraw Solution Park.
Block diagram
HelpDesk
How to Set a Project Baseline Using ConceptDraw PROJECT

HelpDesk
How to Operate with Project Time Frames in ConceptDraw PROJECT

Work Flow Chart

"Root cause analysis (RCA) is a method of problem solving that tries to identify the root causes of faults or problems.
RCA practice tries to solve problems by attempting to identify and correct the root causes of events, as opposed to simply addressing their symptoms. Focusing correction on root causes has the goal of preventing problem recurrence. RCFA (Root Cause Failure Analysis) recognizes that complete prevention of recurrence by one corrective action is not always possible.
Conversely, there may be several effective measures (methods) that address the root causes of a problem. Thus, RCA is an iterative process and a tool of continuous improvement.
RCA is typically used as a reactive method of identifying event(s) causes, revealing problems and solving them. Analysis is done after an event has occurred. Insights in RCA may make it useful as a preemptive method. In that event, RCA can be used to forecast or predict probable events even before they occur. While one follows the other, RCA is a completely separate process to Incident Management." [Root cause analysis. Wikipedia]
The root cause analysis (RCA) tree diagram example "Manufacturing problem solution" was created using the ConceptDraw PRO diagramming and vector drawing software extended with the solution "Seven Management and Planning Tools" from the Management area of ConceptDraw Solution Park.
Tree diagram

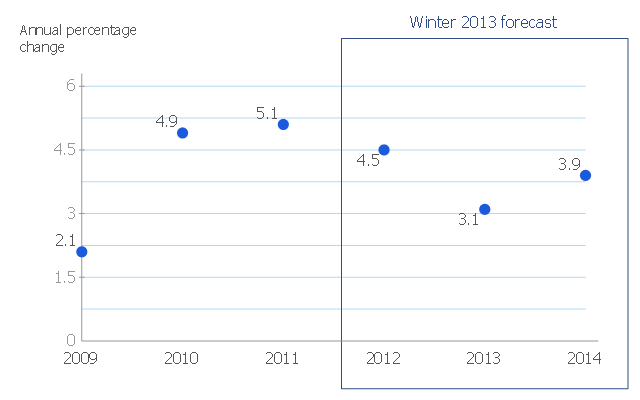
This scatter chart sample shows the MENA's (Middle East and North Africa's) real GDP growth. It was designed on the base scatter graph from the website of the European Economic Forecast (EUROPEAN ECONOMY 1|2013, Economic and Financial Affairs Winter 2013, European Commission). [ec.europa.eu/ economy_ finance/ publications/ european_ economy/ 2013/ pdf/ ee1_ en.pdf]
"The term MENA, for "Middle East and North Africa", is an acronym often used in academic, military planning, disaster relief, and business writing.
Due to the geographic ambiguity and Eurocentric nature of the term "Middle East", many people prefer use of the term WANA (West Asia and North Africa) or the less common NAWA (North Africa-West Asia).
The term covers an extensive region, extending from Morocco to Iran, including the majority of both the Middle Eastern and Maghreb countries. The term is roughly synonymous with the term the Greater Middle East. ...
MENA has no standardized definition; different organizations define the region as consisting of different territories. The following is a list of commonly included countries and territories: Bahrain, Egypt, Iran, Iraq, Israel, Jordan, Kuwait, Lebanon, Yemen, United Arab Emirates, Libya, Morocco, Oman, West Bank and Gaza, Qatar, Saudi Arabia, Syria, Tunisia, Algeria.
Sometimes also included in broader definitions: Armenia, Azerbaijan, Cyprus, Djibouti, Mauritania, Somalia, Sudan, Turkey, Western Sahara." [MENA. Wikipedia]
The scatter chart example "Middle East and North Africa's real GDP growth" was created using the ConceptDraw PRO diagramming and vector drawing software extended with the Line Graphs solution from the Graphs and Charts area of ConceptDraw Solution Park.
Scatter graph
This flow chart sample was drawn on the base on the illustration of the article "Climate change impact on China food security in 2050" from the website of Chinese Academy of Agricultural Sciences .
[caas.cn/ en/ newsroom/ research_ update/ 67347.shtml]
"Food security is a condition related to the ongoing availability of food. ...
According to the Food and Agriculture Organization (FAO), food security "exists when all people, at all times, have physical and economic access to sufficient, safe and nutritious food to meet their dietary needs and food preferences for an active and healthy life". ...
Extreme events, such as droughts and floods, are forecast to increase as climate change takes hold. Ranging from overnight floods to gradually worsening droughts, these will have a range of impacts on the agricultural sector. ...
According to the Climate & Development Knowledge Network report Managing Climate Extremes and Disasters in the Agriculture Sectors: Lessons from the IPCC SREX Report, the impacts will include changing productivity and livelihood patterns, economic losses, and impacts on infrastructure, markets and food security. Food security in future will be linked to our ability to adapt agricultural systems to extreme events." [Food security. Wikipedia]
The flowchart example "Food security assessment" was created using the ConceptDraw PRO diagramming and vector drawing software extended with the Flowcharts solution from the area "What is a Diagram" of ConceptDraw Solution Park.
Flowchart

 Sales Flowcharts
The Sales Flowcharts solution lets you create and display sales process maps, sales process workflows, sales steps, the sales process, and anything else involving sales process management.
- Workflow diagram - Weather forecast | Work Flow Chart | Workflow ...
- Workflow diagram - Weather forecast | Work Flow Chart | Types of ...
- Workflow diagram - Weather forecast | Workflow Diagram Software ...
- Workflow diagram - Weather forecast | Line graph - Template ...
- Workflow diagram - Weather forecast | DFD - Process of account ...
- Workflow Diagrams | Ms Word Documrnt For Weather Forecast
- Workflow diagram - Weather forecast | Simple Flow Chart | Data ...
- Organizational Structure | Workflow diagram - Weather forecast ...
- Workflow diagram - Weather forecast | Weather - Vector stencils ...
- Workflow Diagram Software | Workflow diagram - Weather forecast ...
- Workflow diagram - Weather forecast | Affinity diagram - Business ...
- Workflow diagram - Weather forecast | Money - Vector stencils ...
- Workflow diagram - Weather forecast
- Business Forecast
- Workflow diagram - Weather forecast | Watercraft - Design Elements ...
- Atmosphere air composition | Workflow diagram - Weather forecast ...
- Workflow diagram - Weather forecast | Design elements - Aircraft ...
- Workflow diagram - Weather forecast | Process Flowchart | Types of ...
- Process Flow Chart | Workflow diagram - Weather forecast | Circuits ...
- Water cycle diagram | Workflow diagram - Weather forecast ...
- ERD | Entity Relationship Diagrams, ERD Software for Mac and Win
- Flowchart | Basic Flowchart Symbols and Meaning
- Flowchart | Flowchart Design - Symbols, Shapes, Stencils and Icons
- Flowchart | Flow Chart Symbols
- Electrical | Electrical Drawing - Wiring and Circuits Schematics
- Flowchart | Common Flowchart Symbols
- Flowchart | Common Flowchart Symbols