Material Requisition Flowchart. Flowchart Examples

The flowchart example shows the material requisition business process.
"In elementary algebra, a quadratic equation (from the Latin quadratus for "square") is any equation having the form
ax^2+bx+c=0
where x represents an unknown, and a, b, and c are constants with a not equal to 0. If a = 0, then the equation is linear, not quadratic. The constants a, b, and c are called, respectively, the quadratic coefficient, the linear coefficient and the constant or free term.
Because the quadratic equation involves only one unknown, it is called "univariate". The quadratic equation only contains powers of x that are non-negative integers, and therefore it is a polynomial equation, and in particular it is a second degree polynomial equation since the greatest power is two.
Quadratic equations can be solved by a process known in American English as factoring and in other varieties of English as factorising, by completing the square, by using the quadratic formula, or by graphing." [Quadratic equation. Wikipedia]
The flowchart example "Solving quadratic equation algorithm" was created using the ConceptDraw PRO diagramming and vector drawing software extended with the Mathematics solution from the Science and Education area of ConceptDraw Solution Park.
Solving quadratic equation flow chart

3 Circle Venn Diagram. Venn Diagram Example

Venn Diagrams visualize all possible logical intersections between several sets and are widely used in mathematics, logic, statistics, marketing, sociology, etc.
Venn Diagram Examples for Problem Solving. Computer Science. Chomsky Hierarchy

The Venn diagram example below visualizes the the class of language inclusions described by the Chomsky hierarchy.
Venn Diagram Template for Word

Network Diagram Software Enterprise Private Network
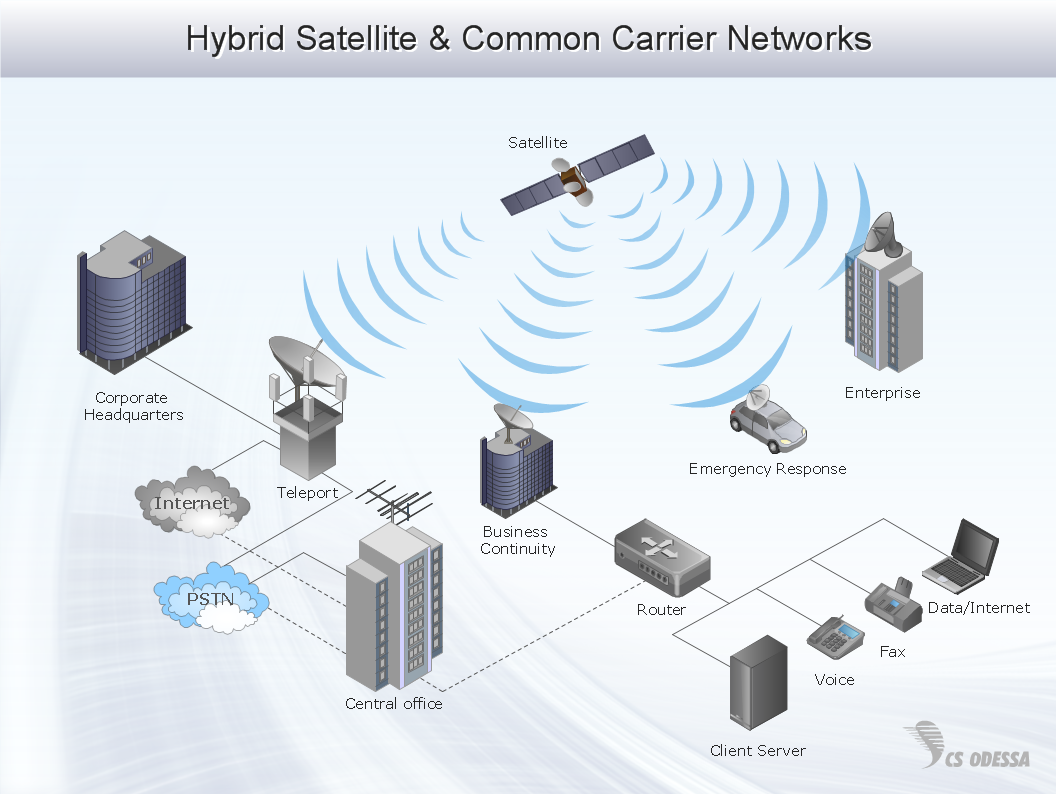

Illustrate the Computer Network of a Building

Venn Diagram Examples for Problem Solving. Venn Diagram as a Truth Table

Venn Diagram Maker

Virtual private networks (VPN). Computer and Network Examples

This example was created in ConceptDraw DIAGRAM using the Computer and Networks Area of ConceptDraw Solution Park and shows the Virtual Private Network (VPN) diagram.
ORM Diagram

Multi Layer Venn Diagram. Venn Diagram Example

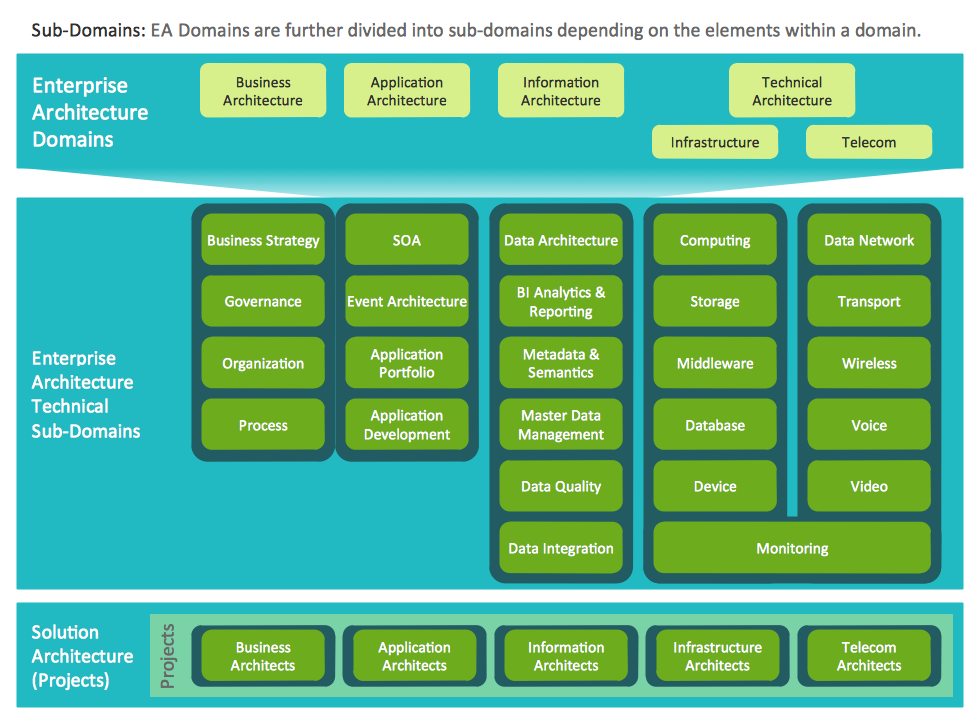
Information Technology Architecture
Definition TQM Diagram

Quality Project Management with Mind Maps

- Basic Example On Elementary Mathematics Of Flowchart
- Example Of Elementary Flowchart
- Flowchart Examples Elementary
- Elementary Algorithms Flowcharts
- Mathematical Example Of Algorithm And Flowchart
- Simple Small Example Of Flowchart Of Maths
- Basic Diagramming | Euclidean algorithm - Flowchart | Accounting ...
- Math Topics Flow Chart Examples
- Basketball Court Dimensions | Venn Diagram Template for Word ...
- Solving quadratic equation algorithm - Flowchart | Material ...
- Euclidean algorithm - Flowchart | Basic Flowchart Symbols and ...
- Sample Algorithm And Flowchart
- Sample Mathematical Flow Chart
- Basic Flowchart Symbols and Meaning | Simple Flow Chart ...
- Example Of Mathemathematics Linear Equation Flowchart
- 2-Set Venn diagram - Template | Venn Diagram Examples for ...
- Purchase Process Flow Chart , Receiving Process Flow Chart
- Solving quadratic equation algorithm - Flowchart | Basic Flowchart ...
- Basic Audit Flowchart . Flowchart Examples | Solving quadratic ...
- Solving quadratic equation algorithm - Flowchart | Solving quadratic ...
- ERD | Entity Relationship Diagrams, ERD Software for Mac and Win
- Flowchart | Basic Flowchart Symbols and Meaning
- Flowchart | Flowchart Design - Symbols, Shapes, Stencils and Icons
- Flowchart | Flow Chart Symbols
- Electrical | Electrical Drawing - Wiring and Circuits Schematics
- Flowchart | Common Flowchart Symbols
- Flowchart | Common Flowchart Symbols