Technical Flow Chart
Flow chart is a diagrammatic representation of an algorithm and essential part of planning the system. Flow charts are widely used in technical analysis and programming for easy writing programs and explaining them to others. So, one of the most popular type of flow charts is Technical Flow Chart.Technical Flow Chart can be drawn by pencil on the paper, but it will be easier to use for designing a special software. ConceptDraw PRO diagramming and vector drawing software extended with Flowcharts Solution from the "Diagrams" Area of ConceptDraw Solution Park will be useful for this goal.
Types of Flowcharts
A Flowchart is a graphically representation of the process, algorithm or the step-by-step solution of the problem. There are ten types of Flowcharts. Using the Flowcharts solution from the Diagrams area of ConceptDraw Solution Park you can easy and quickly design the Flowchart of any of these types.
Marketing - Design Elements
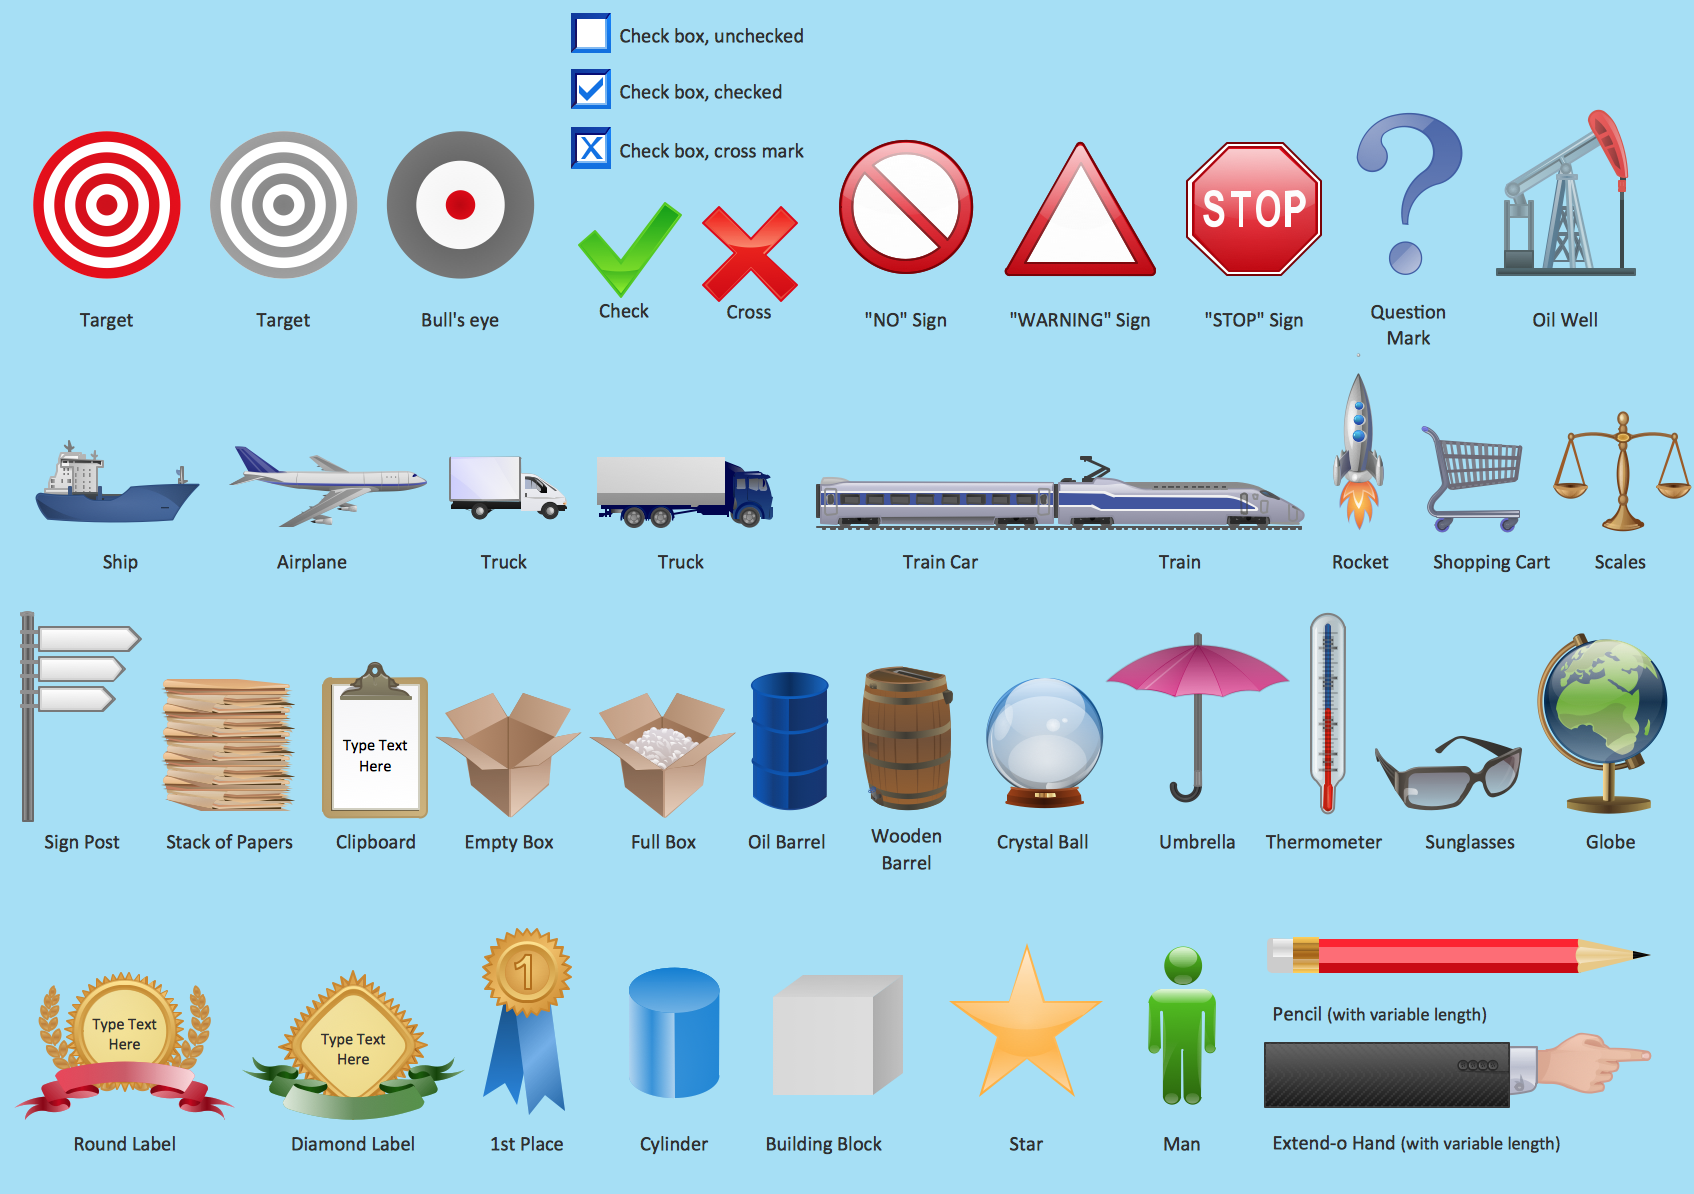
If you need to pull together a quick marketing drawing, you'll find elements, samples, templates and libraries with vector clip art for drawing the Marketing Illustrations.These symbols and signs you can use in your design for Strategic Marketing, Graphic Design, Inbound and Content Marketing, Social Media, Lead Generation, Email Marketing and Automation, CRM implementation and Integration and more.
Lean Six Sigma Diagram Software
Lean Six Sigma (LSS) is a well-known in all over the world methodology of quality improvement and business perfection. ConceptDraw PRO diagramming and vector drawing software is a powerful Lean Six Sigma Diagram Software thanks to the included Value Stream Mapping solution from the Quality Management Area of ConceptDraw Solution Park.How to Draw a Flowchart
Are you confused on how to draw a flow chart? Here are some guidelines which can be used to ease the process of understanding the system and its flow.Although there are many symbols that can be used in flowcharts to represent different kinds of steps, accurate flowcharts can be created using very few (e.g. Process, Decision, Start, delay, cloud).
Managing the task list
Four lessons explaining how to manage your task list in a Gantt chart. You will learn how to adjust your Gantt chart view, how to add/delete tasks or subtasks, how to change tasks hierarchy, how to show/hide subtasks.Business Process Flow Diagram
Business Process Flow Diagram is a graphical presentation of business processes and process flows. It is one of the main tool of business analysis and business process re-engineering that lets identify and easy understand process flows within organization.ConceptDraw PRO extended with Business Process Workflow Diagrams solution from the Business Processes area of ConceptDraw Solution Park is a powerful software which lets easy design Business Process Flow Diagram of any complexity.
Definition Flowchart
A flowchart is a type of diagram that represents an algorithm, workflow or process, showing the steps as boxes of various kinds, and their order by connecting them with arrows.This definition flowchart gives a clear answer for the question "What is a flowchart?". It is convenient to use a powerful ConceptDraw PRO software extended with Flowcharts Solution from the "Diagrams" Area of ConceptDraw Solution Park to design flowcharts of various types which will additionally illustrate a definition flowchart.
Contoh Flowchart
A Flowchart is a graphical representation of the algorithm, process or the step-by-step solution of the problem. There are ten various types of Flowcharts. The ConceptDraw allows you to draw the flowchart of any type.The Contoh Flowchart included to Flowcharts solution are professional looking practical samples and you can quick and easy modify them, print, or publish on web.
- Flow Chart For Manufacture Of Pencil Inout And Output
- Pencils Manufacturing Process Chart
- ConceptDraw PRO ER Diagram Tool | Flow Diagram | Technical ...
- Flowchart Programming Project. Flowchart Examples | Technical ...
- Pencil Network Symbols
- Flowchart | How To Create a FlowChart using ConceptDraw | Social ...
- Basic Flowchart Symbols and Meaning | Process Flowchart | Types ...
- Paper Manufacturing Process Flow Chart
- Process Flowchart | HR Flowchart Symbols | Basic Flowchart ...
- Process Flowchart | HR Flowchart Symbols | Manufacturing and ...
- ERD | Entity Relationship Diagrams, ERD Software for Mac and Win
- Flowchart | Basic Flowchart Symbols and Meaning
- Flowchart | Flowchart Design - Symbols, Shapes, Stencils and Icons
- Flowchart | Flow Chart Symbols
- Electrical | Electrical Drawing - Wiring and Circuits Schematics
- Flowchart | Common Flowchart Symbols
- Flowchart | Common Flowchart Symbols


