Flowchart

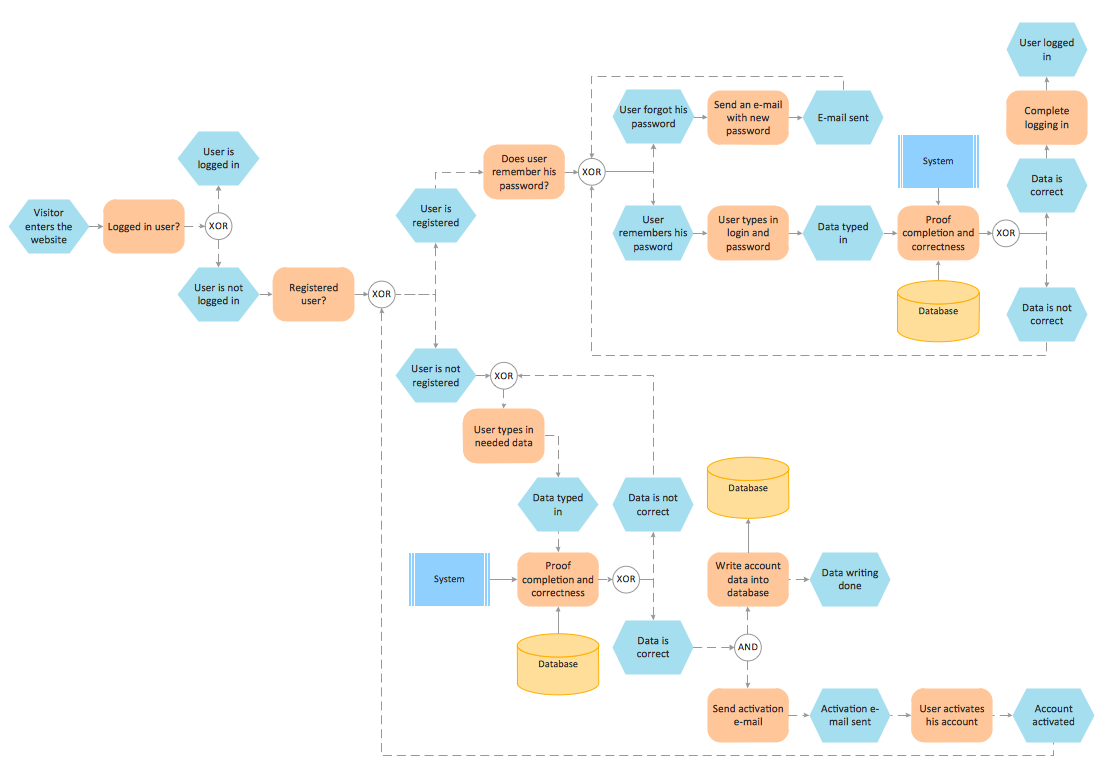
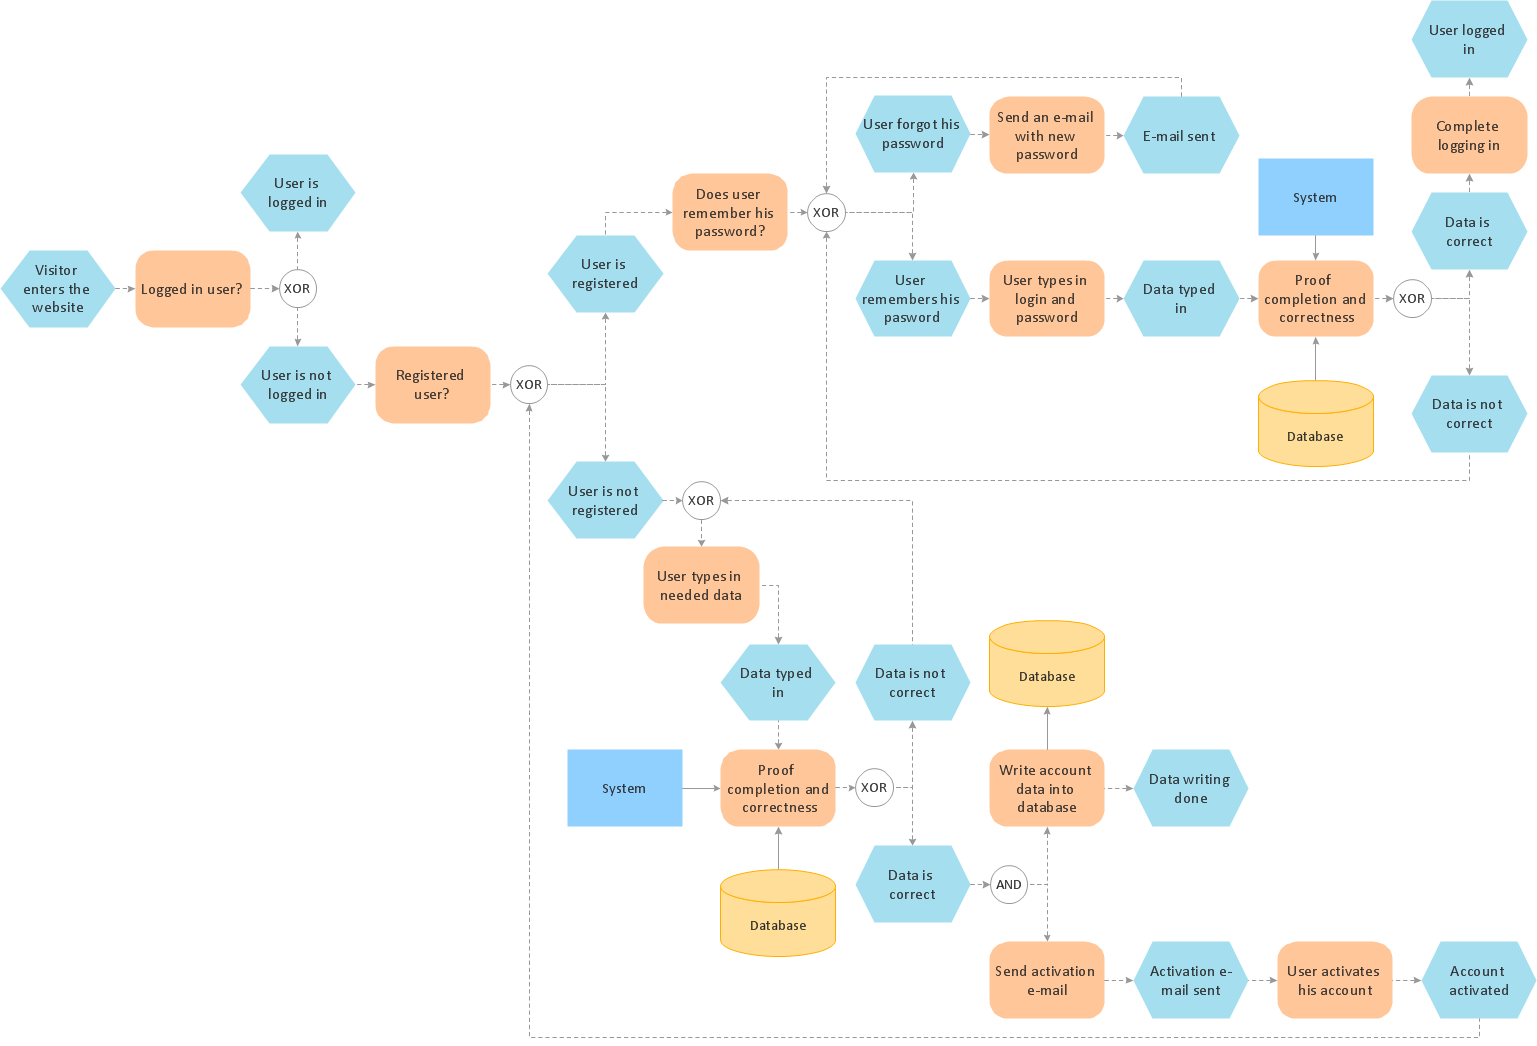
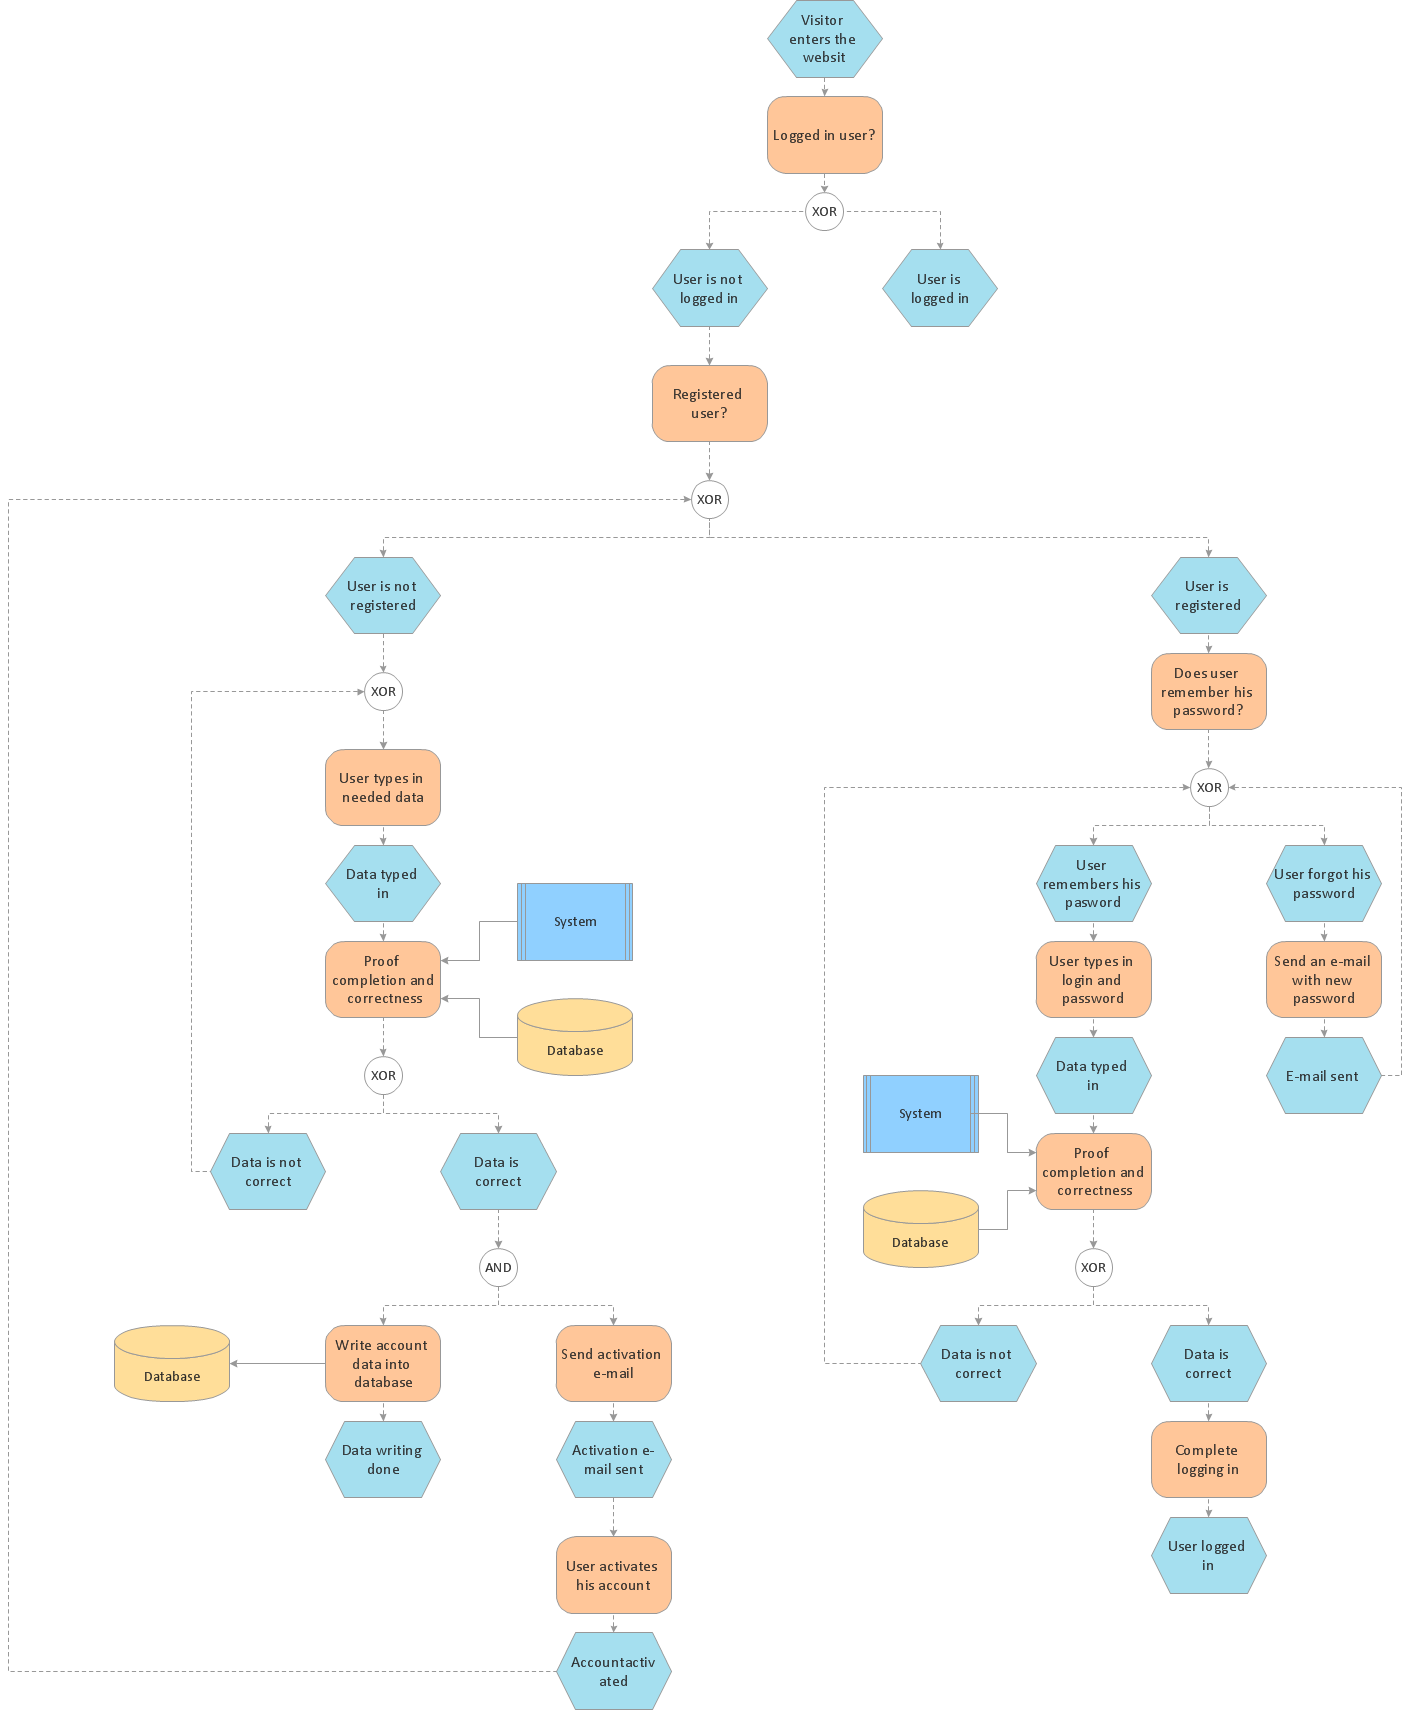
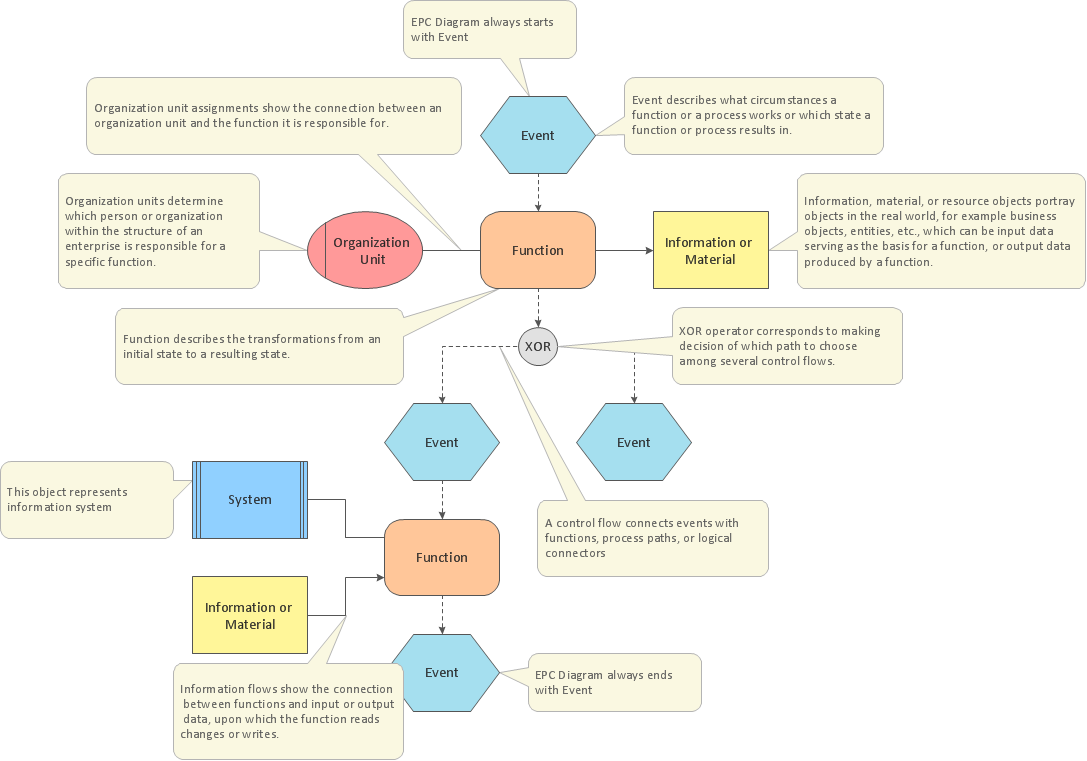
Business process Flow Chart — Event-Driven Process chain (EPC) diagrams

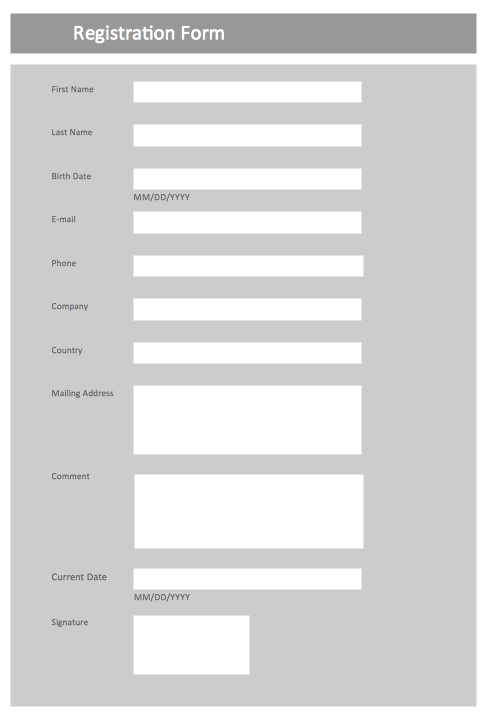
UML Use Case Diagram Example. Registration System

This sample was created in ConceptDraw DIAGRAM diagramming and vector drawing software using the UML Use Case Diagram library of the Rapid UML Solution from the Software Development area of ConceptDraw Solution Park.
This sample shows the types of user’s interactions with the system and is used at the registration and working with the database system.
EPC (Event-driven Process Chain) Flowcharts

Event-Driven Process Сhain Diagrams for improvement throughout an organisation.
Formalization and Verification of Event-driven Process chain
ConceptDraw DIAGRAM - software that reduces the time needed to create a business process model.
Process Modelling using Event-driven Process chain
ConceptDraw DIAGRAM - business process mapping software that reduces the time needed to create a business process model.
 Event-driven Process Chain Diagrams
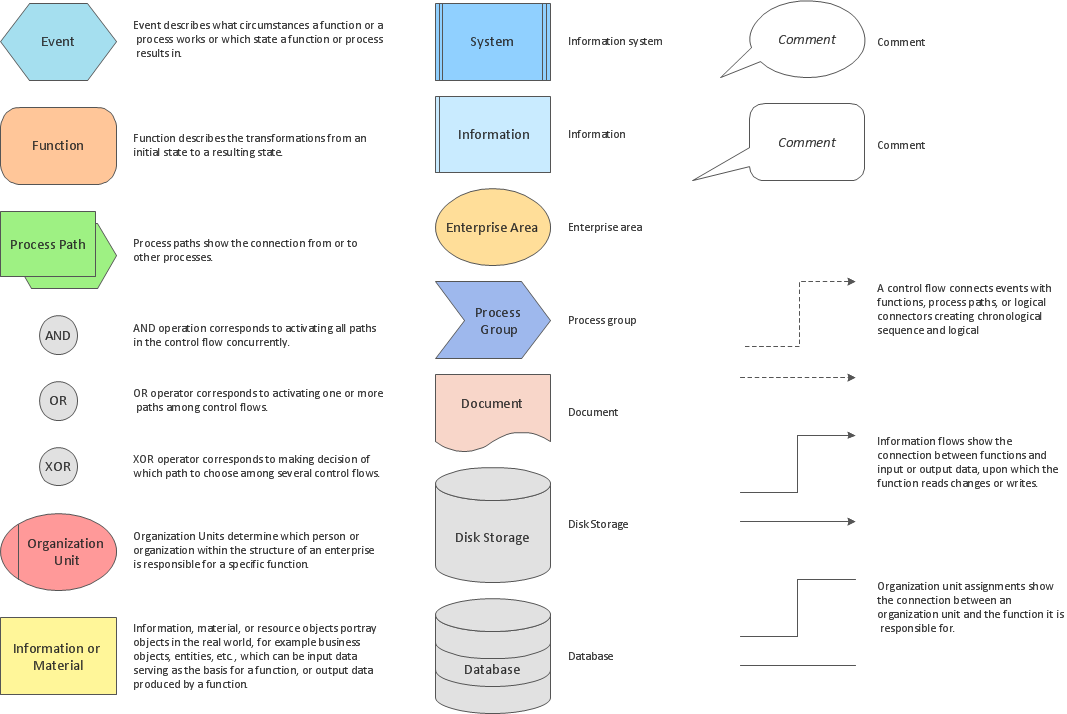
Event-Driven Process Chain Diagrams solution extends ConceptDraw DIAGRAM functionality with event driven process chain templates, samples of EPC engineering and modeling the business processes, and a vector shape library for drawing the EPC diagrams and EPC flowcharts of any complexity. It is one of EPC IT solutions that assist the marketing experts, business specialists, engineers, educators and researchers in resources planning and improving the business processes using the EPC flowchart or EPC diagram. Use the EPC solutions tools to construct the chain of events and functions, to illustrate the structure of a business process control flow, to describe people and tasks for execution the business processes, to identify the inefficient businesses processes and measures required to make them efficient.
The Best Tool for Business Process Modeling

Event-Driven Process chain Diagrams for improvement throughout an organisation.
ConceptDraw DIAGRAM - software that reduces the time needed to create a business process model and is great business process improvement tools.
An Event-driven Process Chain (EPC) - flowchart used for business process modelling

ConceptDraw DIAGRAM is a software for making EPC flowcharts to provide business process modelling. Its excellent business process improvement tools.
Form Maker
How to Help Customers be More Productive
Don't know how to start to draw Connector's improvement?
Curious how should diagramming software work?
Drawing programs involve a lot of things like designs in an illustrative way, creating an cherts, Tools to create high end graphics, create dashboards, using your data and many other technical aspects do it in a much professional and in a quick way.
This flowchart example was created on the base of land sales process diagram from the Property management webpage of the VicRoads website.
[www.vicroads.vic.gov.au/ planning-and-projects/ property-services/ property-management]
"VicRoads or the Roads Corporation of Victoria is a statutory corporation which is the state road and traffic authority in the state of Victoria, Australia. It is responsible for maintenance and construction of the state arterial road network, as well as driver licensing and vehicle registration. VicRoads has broad responsibility for road safety policy and research. It is also responsible for regulating the accident towing industry in Victoria." [VicRoads. Wikipedia]
"Sales Process.
Once it has been established with the relevant VicRoads Regions/ Projects and other business areas that properties are identified as surplus to VicRoads’ operational needs, they are incorporated in the VicRoads annual sales program.
Following approval: relevant VicRoads Regional Manager and the VicRoads Chief Executive (and in some circumstances Minster for Public Transport and Roads) must approve all land deemed surplus and available for disposal.
The method of sale is then determined and consultant advice is sought:
(1) Planning.
(2) Valuer General Victoria (Valuer General’s office must provide a valuation for all sales).
(3) Government Land Monitor (Land Monitor approval is sought if the value exceeds $750,000).
(4) Environmental.
(5) Local Council." [www.vicroads.vic.gov.au/ planning-and-projects/ property-services/ property-management]
The example "Land sales process flowchart" was created using the ConceptDraw PRO diagramming and vector drawing software extended with the Sales Flowcharts solution from the Marketing area of ConceptDraw Solution Park.
Sales process chart

Business Process Modeling with EPC
ConceptDraw DIAGRAM - software that reduces the time needed to create a business process model.
Event Driven Process chain (EPC) Diagrams
ConceptDraw DIAGRAM - software that reduces the time needed to create a business process model.
Business Process Modeling with ConceptDraw
- Sample Flowchart For Registration Process
- Flowchart Of Registration Process
- Website Login And Registration Process Flowchart
- Login and registration processing - EPC diagram | Flowchart ...
- Flowchart | Business process Flow Chart - Event-Driven Process ...
- Design Registration Process Simple Flowchart
- Flowchart | UML Use Case Diagram Example Registration System ...
- UML Use Case Diagram Example Registration System | Business ...
- Flow Chart Of Registration Process
- Flowchart | Business process Flow Chart - Event-Driven Process ...
- Flowchart | Business process Flow Chart - Event-Driven Process ...
- Flow Chart Of Registration Form Process
- UML Use Case Diagram Example Registration System | Flowchart ...
- UML Use Case Diagram Example Registration System | Use Case ...
- Flow Chart Of Company Registration Process
- Flowchart | Business process Flow Chart - Event-Driven Process ...
- Flowchart | Data Flow Diagrams | Wireframe Examples | User ...
- UML Use Case Diagram Example Registration System
- Login and registration processing - EPC diagram | Basic Flowchart ...
- Form Maker | Flowchart | UML Use Case Diagram Example ...
- ERD | Entity Relationship Diagrams, ERD Software for Mac and Win
- Flowchart | Basic Flowchart Symbols and Meaning
- Flowchart | Flowchart Design - Symbols, Shapes, Stencils and Icons
- Flowchart | Flow Chart Symbols
- Electrical | Electrical Drawing - Wiring and Circuits Schematics
- Flowchart | Common Flowchart Symbols
- Flowchart | Common Flowchart Symbols