How to Create a Social Media DFD Flowchart

It allows companies to be more effective in timely messaging thanks to the ability for rapid response to a customer′s post in social media. This saves budget for companies who use social media for promoting and as a lead generation tool.
UML Use Case Diagram Example. Social Networking Sites Project

This sample shows the Facebook Socio-health system and is used at the projection and creating of the social networking sites.
UML Class Diagram Example - Social Networking Site
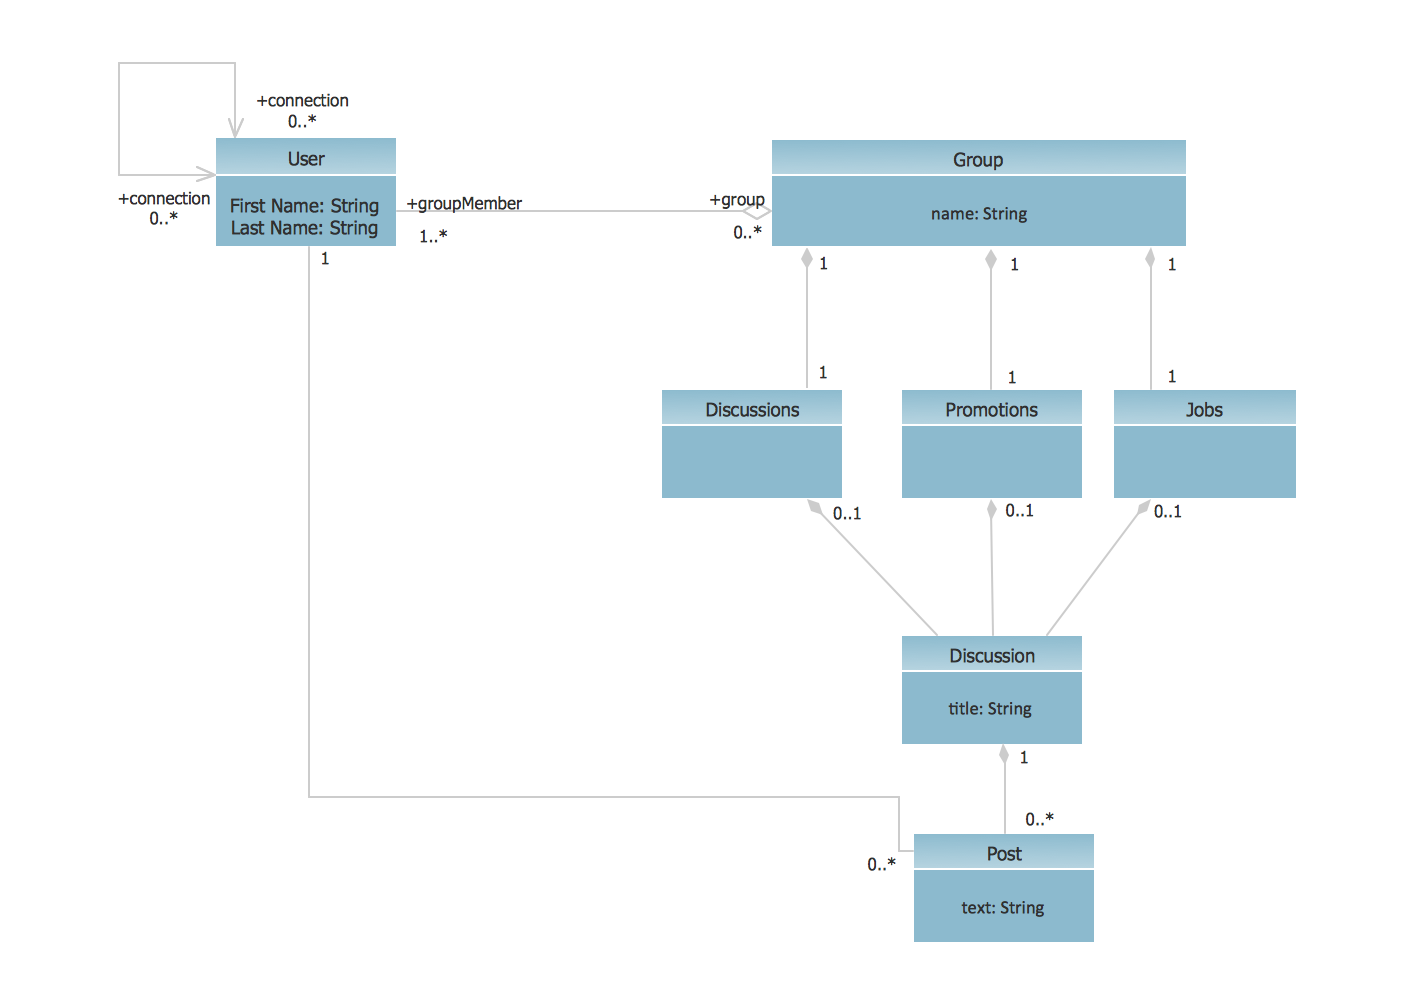
This sample shows the structure of the popular social networking site Linkedin and is used in the business field, in IT, at the projection and creating of the social networking sites.
Social Media Flowchart Symbols

 Social Media Response
This solution extends ConceptDraw DIAGRAM and ConceptDraw MINDMAP with the ability to draw interactive flow charts with action mind map templates, to help create an effective response to applicable social media mentions.
Business Diagram Software


Model Based Systems Engineering

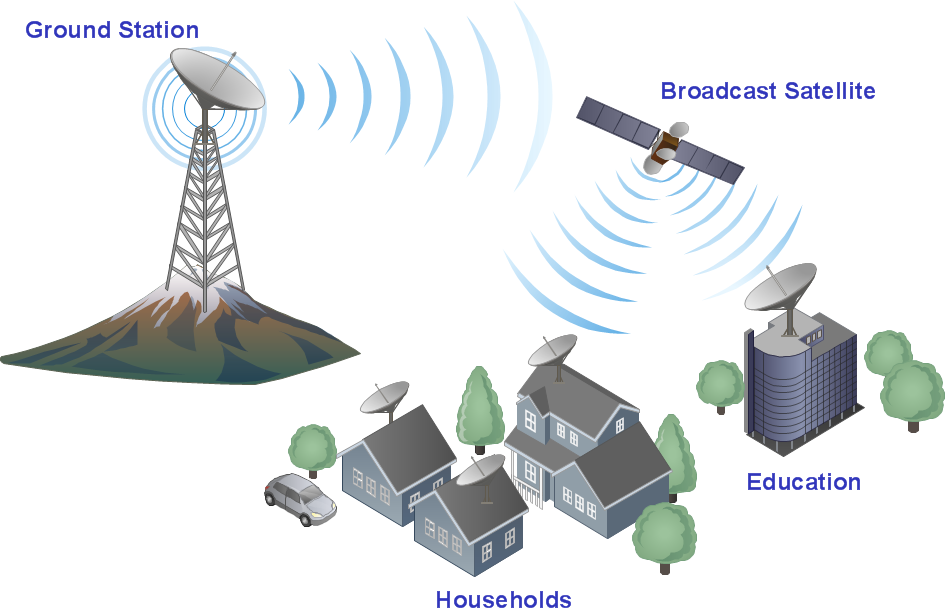
Wireless Networking for Mac
HelpDesk
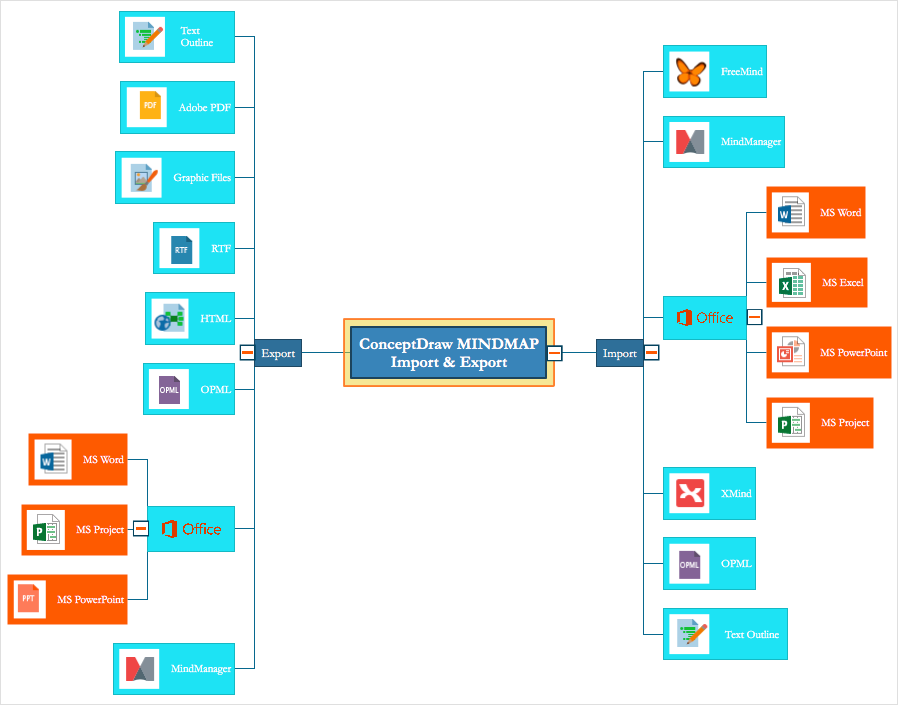
How to Share Your Mind Maps With Others
Activity on Node Network Diagramming Tool

This sample shows the Activity on node network diagramming method. It was created in ConceptDraw DIAGRAM diagramming and vector drawing software using the Seven Management and Planning Tools solution from the Management area of ConceptDraw Solution Park.
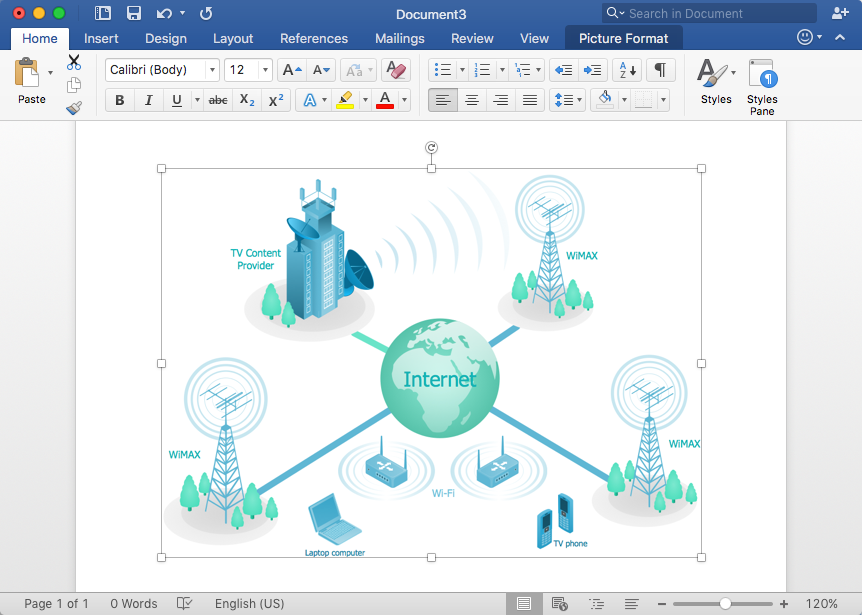
HelpDesk
How to Add a Telecommunication Network Diagram to MS Word
Financial Trade UML Use Case Diagram Example

This sample shows the work of the Financial Trade sphere and can be used by trading companies, commercial organizations, traders, different exchanges.
HelpDesk
How to Connect an Image to a Topic in Your Mind Map

HelpDesk
How to Import MS Project File to a Mind Map Using the Project Exchange Solution

- Flowchart For Social Networking Website Project
- UML Use Case Diagram Example Social Networking Sites Project ...
- Business Diagram Software | UML Class Diagram Example - Social ...
- Flowchart Diagram For Building Social Networks Website
- UML Use Case Diagram Example Social Networking Sites Project ...
- How to Create a Social Media DFD Flowchart | Example of DFD for ...
- System Flowchart For Social Networking Site
- How to Create a Social Media DFD Flowchart | Social Media ...
- Social Media Response | UML Class Diagram Example - Social ...
- How to Create a Social Media DFD Flowchart | Business Diagram ...
- UML Class Diagram Example - Social Networking Site | Social ...
- How to Create a Social Media DFD Flowchart | Data Flow Diagrams ...
- UML Use Case Diagram Example Social Networking Sites Project ...
- UML Use Case Diagram Example Social Networking Sites Project ...
- Cross-Functional Flowcharts | UML Use Case Diagram Example ...
- UML Use Case Diagram Example Social Networking Sites Project ...
- UML Class Diagram Example - Social Networking Site | UML Use ...
- UML Use Case Diagram Example Social Networking Sites Project ...
- UML Use Case Diagram Example Social Networking Sites Project ...
- How to Create a Social Media DFD Flowchart | UML Use Case ...
- ERD | Entity Relationship Diagrams, ERD Software for Mac and Win
- Flowchart | Basic Flowchart Symbols and Meaning
- Flowchart | Flowchart Design - Symbols, Shapes, Stencils and Icons
- Flowchart | Flow Chart Symbols
- Electrical | Electrical Drawing - Wiring and Circuits Schematics
- Flowchart | Common Flowchart Symbols
- Flowchart | Common Flowchart Symbols