Basic Flowchart Symbols and Meaning


Process Flowchart


Accounting Flowchart Symbols

Types of Flowcharts


Flow Chart Design - How to Design a Good Flowchart

Cross-Functional Flowchart

Use cross-functional flowcharts to show the relationship between a business process and the functional units (such as departments) responsible for that process. To create it use the best flowchart maker of ConceptDraw PRO.

Flowchart Software

Cross-Functional Flowchart (Swim Lanes)

Use flowchart maker of ConceptDraw PRO enhanced with solutions from ConceptDraw Solution Park to create diagrams to present and explain structures, process flows, logical relationships, networks, design schemes and other visually organized information and knowledge.
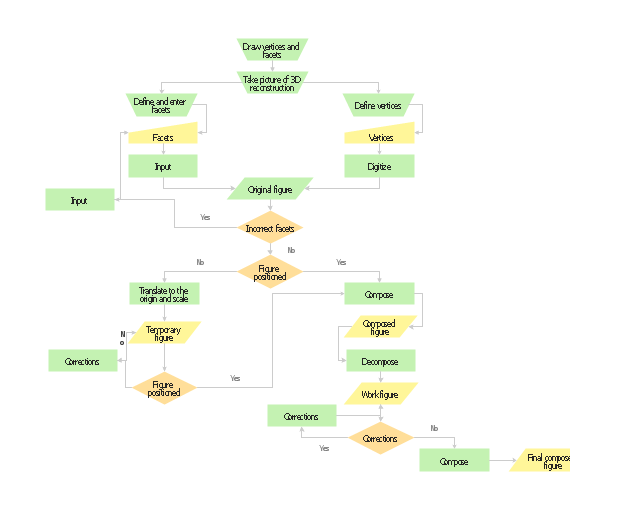
Planning scheme for the construction of a synthetic object.
"Computer-generated imagery (CGI) ... is the application of computer graphics to create or contribute to images in art, printed media, video games, films, television programs, commercials, and simulators. The visual scenes may be dynamic or static, and may be two-dimensional (2D), though the term "CGI" is most commonly used to refer to 3D computer graphics used for creating scenes or special effects in films and television." [Computer-generated imagery. Wikipedia]
The flow chart example "Synthetic object construction" was created using the ConceptDraw PRO diagramming and vector drawing software extended with the Flowcharts solution from the area "What is a Diagram" of ConceptDraw Solution Park.
Flowchart - Synthetic object construction
Process Flow app for macOS

Diagram Flow Chart

Approval Process and Segregation of Responsibilities Accounting Flowchart Example

Creating a Simple Flowchart

 Cross-Functional Flowcharts
Cross-functional flowcharts are powerful and useful tool for visualizing and analyzing complex business processes which requires involvement of multiple people, teams or even departments. They let clearly represent a sequence of the process steps, the order of operations, relationships between processes and responsible functional units (such as departments or positions).
Account Flowchart. Flowchart Examples

The flow chart example shows the computer network system account processing.
- Flow Chart Of Operating System Of Computer
- Flow Chart For Computer Operation
- Computer Operating System Chart Flow
- Computer System Operation Connector Machine
- Flow Chart Of Basic Computer Operation
- Flowchart For Computer Working Operation
- Flow Chart The Simple Computer Network Systems
- Flow Chart Of Computer Graphics
- EFS Operation | ConceptDraw Arrows10 Technology | Flow chart ...
- Accounting Flowcharts | How to Create Flowcharts for an Accounting ...
- Process Flowchart | Basic Flowchart Symbols and Meaning ...
- Flowchart Symbol For Computer Program Operating
- Near-me area networks (NAN). Computer and Network Examples ...
- Computer Program Flowchart
- Accounting Flowcharts | Data Flow Diagram Process | How Do You ...
- Hotel Operation Flow Chart
- The Role Of Computer In Solving Operation Research Problems
- Computer Data Flow Chart
- Basic Flowchart Symbols and Meaning | Process Flowchart | Types ...
- Flowchart Of Gps
- ERD | Entity Relationship Diagrams, ERD Software for Mac and Win
- Flowchart | Basic Flowchart Symbols and Meaning
- Flowchart | Flowchart Design - Symbols, Shapes, Stencils and Icons
- Flowchart | Flow Chart Symbols
- Electrical | Electrical Drawing - Wiring and Circuits Schematics
- Flowchart | Common Flowchart Symbols
- Flowchart | Common Flowchart Symbols