Flow chart Example. Warehouse Flowchart

Standard warehousing process flow diagram and standard workflow diagram used for process identification for further evaluating effectiveness and profitability of overall business process. Use the ConceptDraw PRO diagramming and vector drawing software extended with the Flowcharts solution from the Diagrams area of ConceptDraw Solution Park to design your own workflow diagrams, process flow diagram and flow charts. Need to use Process Flow Diagram for designing Warehouse packages flow.

 Plant Layout Plans
This solution extends ConceptDraw PRO v.9.5 plant layout software (or later) with process plant layout and piping design samples, templates and libraries of vector stencils for drawing Plant Layout plans. Use it to develop plant layouts, power plant desig
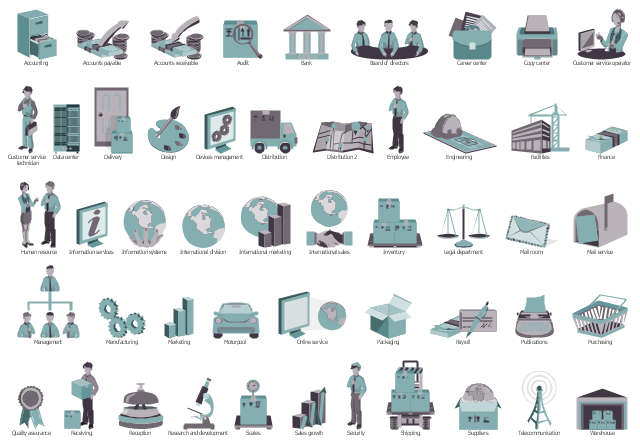
The vector stencils library "HR department" contains 49 department symbols.
Use it to design your HR flowcharts, workflow diagrams and process charts by the ConceptDraw PRO diagramming and vector drawing software.
"Functional departmentalization - Grouping activities by functions performed. Activities can be grouped according to function (work being done) to pursue economies of scale by placing employees with shared skills and knowledge into departments for example human resources, IT, accounting, manufacturing, logistics, and engineering. Functional departmentalization can be used in all types of organizations." [Departmentalization. Wikipedia]
The shapes example "Design elements - HR department" is included in the HR Flowcharts solution from the Management area of ConceptDraw Solution Park.
Department symbols for HR workflow diagrams
HelpDesk
How to Draw a Gantt Chart Using ConceptDraw PRO

Example of DFD for Online Store (Data Flow Diagram) DFD Example

Example of DFD for Online Store shows the Data Flow Diagram for online store and interactions between the Visitors, Customers and Sellers, as well as Website Information and User databases.

ORM Diagram

- Process Flowchart | Flow process chart | Flow chart Example ...
- Process Flowchart | Flow chart Example . Warehouse Flowchart ...
- Flow chart Example . Warehouse Flowchart
- Workflow Diagram Examples | Workflow Diagrams | Flow chart ...
- Overview | Flow chart Example . Warehouse
- Process Flowchart | Flow chart Example . Warehouse Flowchart ...
- Flow chart Example . Warehouse Flowchart | Workflow Diagram ...
- Flow chart Example . Warehouse Flowchart | Logistics ...
- Process Flowchart | Basic Flowchart Symbols and Meaning | Flow ...
- Flow chart Example . Warehouse Flowchart
- Process Flowchart | Flow chart Example . Warehouse Flowchart ...
- Data Flow Diagram | Data Flow Diagrams | Flow chart Example ...
- Flow chart Example . Warehouse Flowchart | Process Flowchart ...
- Flow chart Example . Warehouse Flowchart | Warehouse layout floor ...
- Flow chart Example . Warehouse Flowchart | Basic Flowchart ...
- Process Flowchart | Flow chart Example . Warehouse Flowchart ...
- Flow chart Example . Warehouse Flowchart | ORM Diagram | Design ...
- Flow chart Example . Warehouse Flowchart | Create Flow Chart on ...
- Cross Functional Flowchart Examples | Types of Flowchart ...
- Examples of Flowchart | Flow chart Example . Warehouse Flowchart ...
- ERD | Entity Relationship Diagrams, ERD Software for Mac and Win
- Flowchart | Basic Flowchart Symbols and Meaning
- Flowchart | Flowchart Design - Symbols, Shapes, Stencils and Icons
- Flowchart | Flow Chart Symbols
- Electrical | Electrical Drawing - Wiring and Circuits Schematics
- Flowchart | Common Flowchart Symbols
- Flowchart | Common Flowchart Symbols