BPR Diagram. Business Process Reengineering Example

UML Use Case Diagram Example. Social Networking Sites Project

This sample shows the Facebook Socio-health system and is used at the projection and creating of the social networking sites.
Types of Flowcharts


Pyramid Diagram

Example of DFD for Online Store (Data Flow Diagram)

Example of DFD for Online Store shows the Data Flow Diagram for online store and interactions between the Visitors, Customers and Sellers, as well as Website Information and User databases.

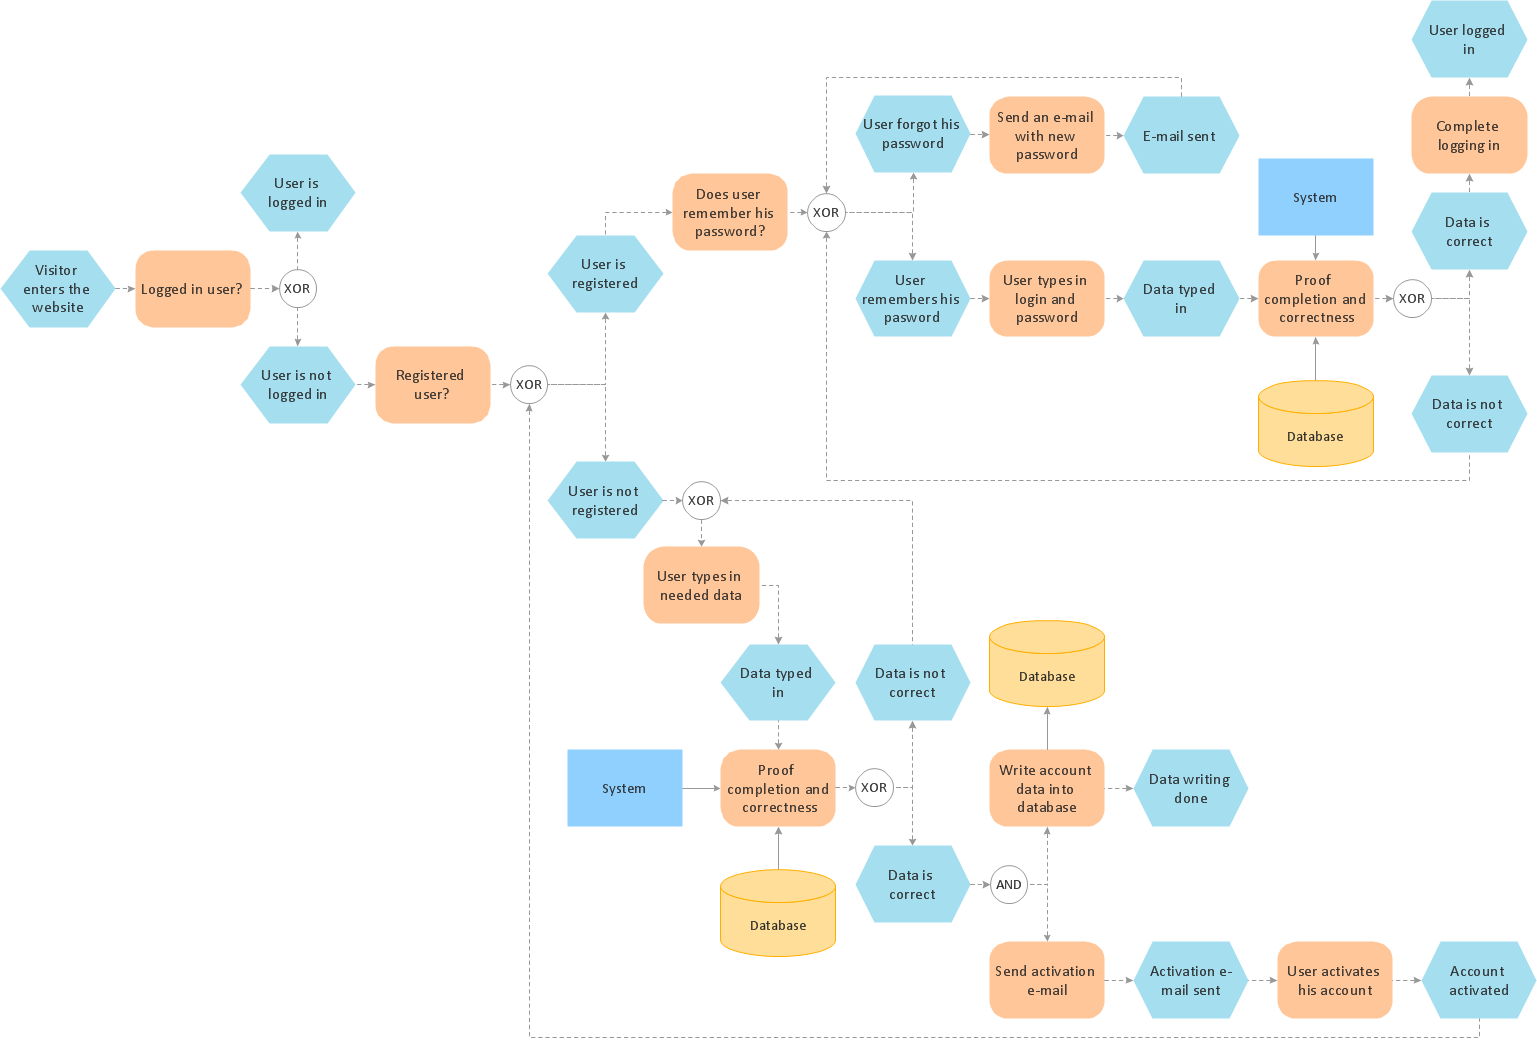
Business Process Flow Diagram

ConceptDraw DIAGRAM extended with Business Process Workflow Diagrams solution from the Business Processes area of ConceptDraw Solution Park is a powerful software which lets easy design Business Process Flow Diagram of any complexity.
Sales Process Flowchart. Flowchart Examples

Material Requisition Flowchart. Flowchart Examples

The flowchart example shows the material requisition business process.
 Business Process Diagrams
Business Process Diagrams solution extends the ConceptDraw DIAGRAM BPM software with RapidDraw interface, templates, samples and numerous libraries based on the BPMN 1.2 and BPMN 2.0 standards, which give you the possibility to visualize equally easy simple and complex processes, to design business models, to quickly develop and document in details any business processes on the stages of project’s planning and implementation.
EPC (Event-driven Process Chain) Flowcharts
Event-Driven Process Сhain Diagrams for improvement throughout an organisation.
- E Commerce Business Process Flow
- Ecommerce Cross Functional Flowchart
- Types of Flowcharts | Dfd Diagram For E Commerce Website
- B2c Ecommerce Site Map
- Accounting Flowcharts | Business Process Diagrams | Business ...
- E Commerce Flow Chart
- Flowchart For Ecommerce Website
- Ecommerce Flowchart Infographic
- Business Process Diagrams | Office Layout Plans | E Commerce ...
- Workflow Of E Commerce Websites
- ERD | Entity Relationship Diagrams, ERD Software for Mac and Win
- Flowchart | Basic Flowchart Symbols and Meaning
- Flowchart | Flowchart Design - Symbols, Shapes, Stencils and Icons
- Flowchart | Flow Chart Symbols
- Electrical | Electrical Drawing - Wiring and Circuits Schematics
- Flowchart | Common Flowchart Symbols
- Flowchart | Common Flowchart Symbols