Business diagrams & Org Charts with ConceptDraw DIAGRAM


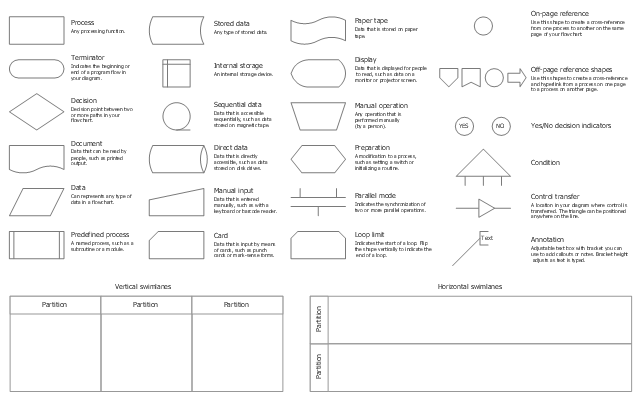
The vector stencils library "Cross-functional flowcharts" contains 31 symbols for creating the deployment flow charts using the ConceptDraw PRO diagramming and vector drawing software.
"A deployment flowchart (sometimes referred to as a "cross functional flowchart") is a business process mapping tool used to articulate the steps and stakeholders of a given process. ...
As deployment flowcharts highlight the relationships between stakeholders in addition to the process flow they are especially useful in highlighting areas of inefficiency, duplication or unnecessary processing. Often utilized within Six sigma activity, completed flowcharts are commonly used to examine the interfaces between “participants” which are typically causes for delays and other associated issues. Deployment flowcharts are useful for determining who within an organization is required to implement a process and are sometimes used as a business planning tool." [Deployment flowchart. Wikipedia]
The example "Design elements - Cross-functional flowcharts" is included in the Cross-Functional Flowcharts solution from the Business Processes area of ConceptDraw Solution Park.
Cross-functional flowchart shapes
HelpDesk
How to Create a Fishbone (Ishikawa) Diagram Quickly
 Diagram Quickly")
- Business Planning Flowchart
- Process Flowchart | HVAC Plans | Types of Flowcharts | Diagram A ...
- Business Planning Process Flow Chart
- Business Plan Mapping
- HVAC Business Plan | How To Create Restaurant Floor Plan in ...
- Work Flow Chart Of Business Plan
- Business Plan Flow Chart
- HVAC Business Plan | How to Collaborate in Business via Skype ...
- Diagram Of Business Plan
- Business Planning Process Flowchart
- Flow Chart Sample Of Business Plan
- Business Planning Process Diagram
- HVAC Business Plan | Online Collaboration via Skype | HVAC Plans ...
- Flowchart Business Planning
- In Flow Chart Business Development Plan
- Diagram Of A Business Plan
- Production Planning Process Flowchart
- Software Deployment Plan Flow Chart
- Flowchart Business Plan
- Business Planning Process With Diagram
- ERD | Entity Relationship Diagrams, ERD Software for Mac and Win
- Flowchart | Basic Flowchart Symbols and Meaning
- Flowchart | Flowchart Design - Symbols, Shapes, Stencils and Icons
- Flowchart | Flow Chart Symbols
- Electrical | Electrical Drawing - Wiring and Circuits Schematics
- Flowchart | Common Flowchart Symbols
- Flowchart | Common Flowchart Symbols