Process Flowchart


This work flow chart sample was redesigned from the picture "Simulation for earthquake disaster assessment" from the article "Simulation Workflows".
[iaas.uni-stuttgart.de/ forschung/ projects/ simtech/ sim-workflows.php]
" This simulation was developed to have an in depth understanding of the destructions and the decisions to be made in various phases of crisis management (Source: Mahdi Hashemi and Ali A. Alesheikh (2010). "Developing an agent based simulation model for earthquakes in the context of SDI." GSDI 12 World Conference. 19 – 22 October 2010. Singapour). The simulation process contains following major steps:
(1) All spatial information including satellite images (before and after the earthquake) and topographic/ cadastral maps of the area are mosaicked and georeferenced. The parts of the city that contain various levels of destructions are selected. Three types of features namely buildings, roads and recreational areas are classified and extracted from the satellite images.
(2) The governing factors of destructions are identified; a mathematical model that integrates the factors is constructed.
(3) The simulation is constructed for various parameter values (different earthquake strength, time elapses, etc.)" [iaas.uni-stuttgart.de/ forschung/ projects/ simtech/ sim-workflows.php]
The example "Workflow diagram - Earthquake disaster assessment" was drawn using the ConceptDraw PRO diagramming and vector drawing software extended with the Workflow Diagrams solution from the Business Processes area of ConceptDraw Solution Park.
Work flow chart

This work flow chart sample was redesigned from the picture "Weather Forecast" from the article "Simulation Workflows".
[iaas.uni-stuttgart.de/ forschung/ projects/ simtech/ sim-workflows.php]
"(1) The weather is predicted for a particular geological area. Hence, the workflow is fed with a model of the geophysical environment of ground, air and water for a requested area.
(2) Over a specified period of time (e.g. 6 hours) several different variables are measured and observed. Ground stations, ships, airplanes, weather balloons, satellites and buoys measure the air pressure, air/ water temperature, wind velocity, air humidity, vertical temperature profiles, cloud velocity, rain fall, and more.
(3) This data needs to be collected from the different sources and stored for later access.
(4) The collected data is analyzed and transformed into a common format (e.g. Fahrenheit to Celsius scale). The normalized values are used to create the current state of the atmosphere.
(5) Then, a numerical weather forecast is made based on mathematical-physical models (e.g. GFS - Global Forecast System, UKMO - United Kingdom MOdel, GME - global model of Deutscher Wetterdienst). The environmental area needs to be discretized beforehand using grid cells. The physical parameters measured in Step 2 are exposed in 3D space as timely function. This leads to a system of partial differential equations reflecting the physical relations that is solved numerically.
(6) The results of the numerical models are complemented with a statistical interpretation (e.g. with MOS - Model-Output-Statistics). That means the forecast result of the numerical models is compared to statistical weather data. Known forecast failures are corrected.
(7) The numerical post-processing is done with DMO (Direct Model Output): the numerical results are interpolated for specific geological locations.
(8) Additionally, a statistical post-processing step removes failures of measuring devices (e.g. using KALMAN filters).
(9) The statistical interpretation and the numerical results are then observed and interpreted by meteorologists based on their subjective experiences.
(10) Finally, the weather forecast is visualized and presented to interested people." [iaas.uni-stuttgart.de/ forschung/ projects/ simtech/ sim-workflows.php]
The example "Workflow diagram - Weather forecast" was drawn using the ConceptDraw PRO diagramming and vector drawing software extended with the Workflow Diagrams solution from the Business Processes area of ConceptDraw Solution Park.
Work flow chart

Model Based Systems Engineering

Types of Flowchart - Overview


UML Business Process

Integration Definition

JSD - Jackson system development

When implementing the Jackson System Development method and designing JSD diagrams, you can succesfully use the powerful and helpful tools of ConceptDraw PRO software extended with Entity-Relationship Diagram (ERD) solution from the Software Development area of ConceptDraw Solution Park.
Business Process Modeling Software for Mac

There are 16 BPMN 1.2 and BPMN 2.0 stencil libraries containing 230 vector objects: Rapid Draw library, Connections library, Gateways and Artifacts libraries, Data library, Gateways library, Choreographies library, Conversations library, Activities libraries, Events libraries, Expanded Objects libraries, Swim lanes libraries.
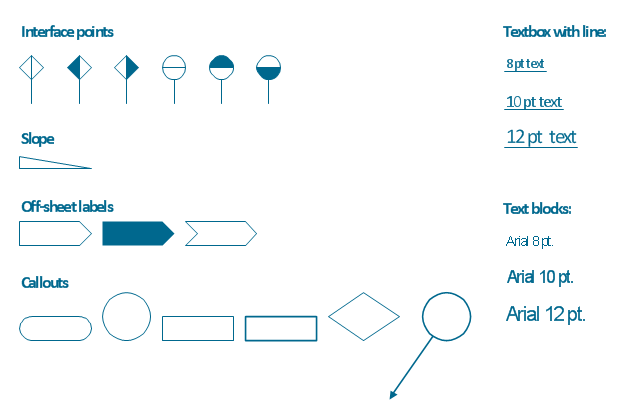
The vector stencils library "Process annotations" contains 22 symbols of interface points, slope, off-sheet labels, callouts and textboxes.
Use these shapes for setting automatic labels to display a datasheet field for a pipeline shape, labels, captions, outlines, off-sheet labels, text balloons, annotations, outlines, tags, and descriptions.
"In engineering a process is a set of interrelated tasks that, together, transform inputs into outputs. These tasks may be carried out by people, nature, or machines using resources; so an engineering process must be considered in the context of the agents carrying out the tasks, and the resource attributes involved. Systems Engineering normative documents and those related to Maturity Models are typically based on processes. For example, System Engineering processes of the EIA-632 and processes involved in the Capability Maturity Model Integration (CMMI) institutionalization and improvement approach. Constraints imposed on the tasks and resources required to implement them are essential for executing the tasks mentioned.
A chemical process is a series of unit operations used to produce a material in large quantities.
In the chemical industry, chemical engineers will use the following to define or illustrate a process:
Process Flow Diagram (PFD),
Piping and instrumentation diagram
(P&ID),
Simplified process description,
Detailed process description,
Project management,
Process simulation." [Process (engineering). Wikipedia]
The example "Design elements - Process annotations" was created using the ConceptDraw PRO diagramming and vector drawing software extended with the Chemical and Process Engineering solution from the Engineering area of ConceptDraw Solution Park.
Process annotation symbols
- Free Flowchart Simulation Software
- Simulation Flow Diagram
- Basic Diagramming | Block Diagrams | Process Flowchart | Different ...
- Process Flowchart | ConceptDraw PRO Network Diagram Tool | Best ...
- Model Simulation Flowchart
- Process Flowchart | Task Involve In Preparing A Conputer Program ...
- Process Flowchart | Decision Tree Simulation
- Process Flowchart | ConceptDraw PRO Network Diagram Tool ...
- Flow Diagram Process Chart Simulation
- Simulation Software For Creating Flowchart
- Process Flowchart | Integration Definition | IDEF | Schematic ...
- Earthquake disaster assessment - Workflow diagram | Work Flow ...
- Project On Earthquake With Flow Charts
- Flowchart Of The Types Of Disasters
- Process Flowchart | What Are The Task Involve In Preparing A ...
- Business Process Modeling Software for Mac | Process Flowchart ...
- Flowchart on Bank. Flowchart Examples | LLNL Flow Charts ...
- How To use House Electrical Plan Software | Process Flowchart ...
- Work Flow Process Chart | Basic Flowchart Symbols and Meaning ...
- Types Of Disasters In Flow Chart
- ERD | Entity Relationship Diagrams, ERD Software for Mac and Win
- Flowchart | Basic Flowchart Symbols and Meaning
- Flowchart | Flowchart Design - Symbols, Shapes, Stencils and Icons
- Flowchart | Flow Chart Symbols
- Electrical | Electrical Drawing - Wiring and Circuits Schematics
- Flowchart | Common Flowchart Symbols
- Flowchart | Common Flowchart Symbols