Flowchart Software

ConceptDraw DIAGRAM flowchart software will help to quickly create new flowcharts, workflow, NS Diagram, BPMN Diagram, Cross-functional flowcharts, data flow diagrams and highlight flowcharts.
Feature-rich flowchart maker, free thousand flowchart examples and templates and colored symbols that will allow you to create professional looking flowcharts simply.
ConceptDraw DIAGRAM supports macOS and Windows.

Visual Presentations Made Easy with Diagramming Software


Flowchart Program Mac
Best Mind Mapping Program for Making Presentations

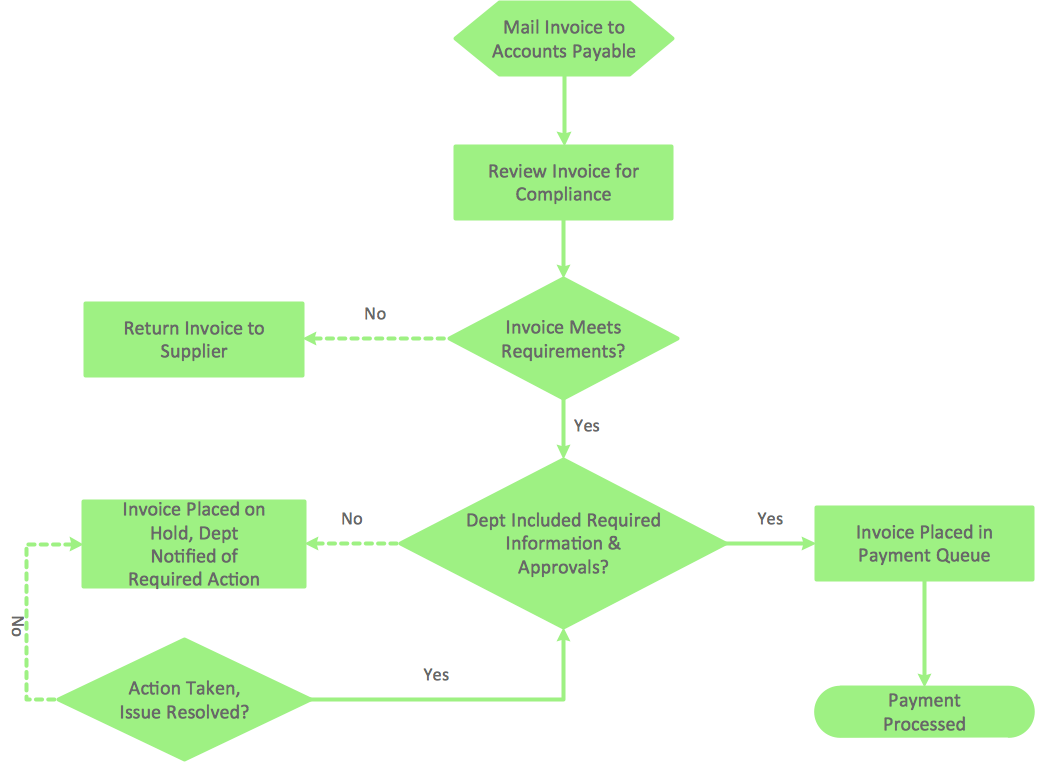
Technical Flow Chart Example

ConceptDraw DIAGRAM enhanced with Flowcharts Solution from the "Diagrams" Area of ConceptDraw Solution is a perfect software for drawing Technical Flow Chart Example illustrating the essence and importance of the technical flow chart use.
Chart Software for Better Presentations

Graphs and Charts Area provide a wide collection of professional looking predesigned templates, samples and ready-to-use vector stencils that will help you to draw the charts and diagrams of various types: Pie Charts, Donut Charts, Line Charts, Column Charts, Bar Charts, Pyramids, Scatter Charts, Venn Diagrams, Spider Charts, Area Charts, Divided Bar Graphs.
Business Process Flow Diagram

ConceptDraw DIAGRAM extended with Business Process Workflow Diagrams solution from the Business Processes area of ConceptDraw Solution Park is a powerful software which lets easy design Business Process Flow Diagram of any complexity.
How to Create Presentation of Your Project Gantt Chart

Flowchart Software

The Flowcharts diagrams are widely used for designing, documenting, analyzing and managing the complex processes and programs in various fields such as business, engineering, architecture, science, manufacturing, administration, etc.
Data Flow Diagram

- Workflow Diagrams | Workflow Presentation Software
- How to Create Presentation of Your Project Gantt Chart ...
- Flowchart Software | Horizontal Org Flow Chart | ConceptDraw PRO ...
- Biology Symbols | Biology Drawing Software | Bio Flowchart Lite ...
- How To Add a Computer Network Diagram to a PowerPoint ...
- Pictorial Presentation Of Flow Chart Symbols
- Workflow Diagram Software Mac
- How To Create a Flow Chart in ConceptDraw | Best Mind Mapping ...
- Free Mind Map Flowchart Software
- Chart Maker for Presentations | Bar Graphs | Basic Flowchart ...
- ERD | Entity Relationship Diagrams, ERD Software for Mac and Win
- Flowchart | Basic Flowchart Symbols and Meaning
- Flowchart | Flowchart Design - Symbols, Shapes, Stencils and Icons
- Flowchart | Flow Chart Symbols
- Electrical | Electrical Drawing - Wiring and Circuits Schematics
- Flowchart | Common Flowchart Symbols
- Flowchart | Common Flowchart Symbols