Social Media Flowchart Symbols

Chart Examples

Pie Chart Examples and Templates

Pie chart examples and templates created using ConceptDraw PRO software helps you get closer with pie charts and find pie chart examples suite your needs.
Pie Graph Worksheets

Pie Donut Chart. Pie Chart Examples

The Pie Donut Chart visualizes the percentage of parts of the whole and looks like as a ring divided into sectors. Pie Donut Charts are widely used in the business, statistics, analytics, mass media.
Chart Maker for Presentations

Line Chart Examples

Chart Templates

 Entity-Relationship Diagram (ERD)
An Entity-Relationship Diagram (ERD) is a visual presentation of entities and relationships. That type of diagrams is often used in the semi-structured or unstructured data in databases and information systems. At first glance ERD is similar to a flowch
HelpDesk
How to Draw a Circular Arrows Diagram Using ConceptDraw PRO

Geo Map - Africa
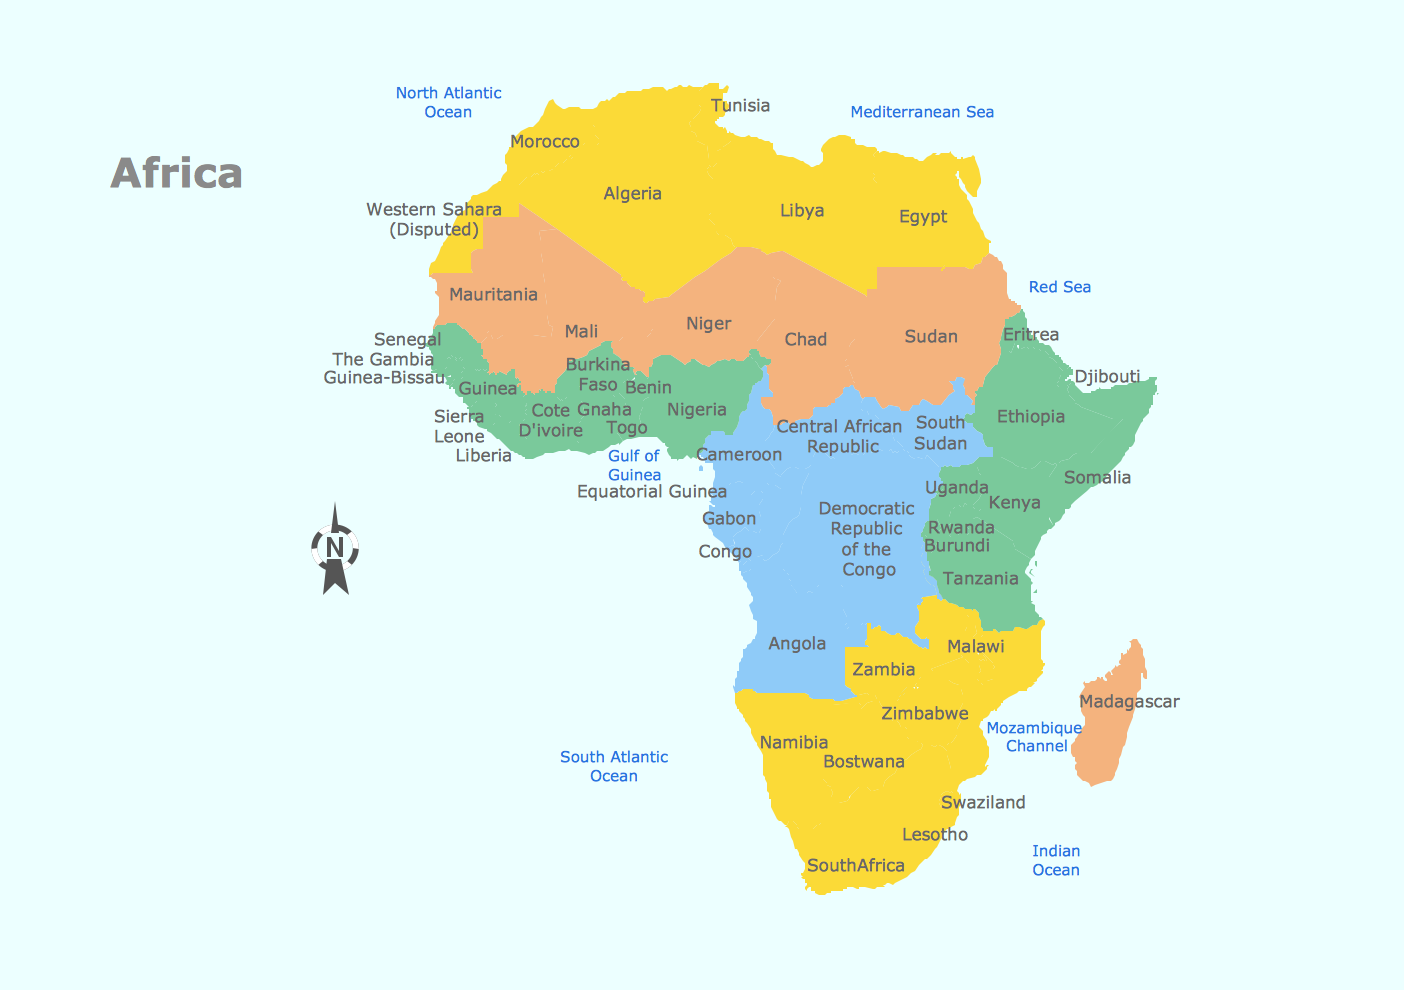
Vector design elements library Africa contains country map contours, geographical maps, cartograms and thematic maps for ConceptDraw PRO diagramming and vector drawing software. To help visualize the business and thematic information connected with geographic areas, locations or customs.
All ConceptDraw PRO documents are vector graphic files and are available for reviewing, modifying, and converting to a variety of formats: image, HTML, PDF file, MS PowerPoint Presentation, Adobe Flash, MS Visio (.VDX, .VSDX).
Geo Map - Europe - Poland

Geo Map - Europe - Norway

Geo Map - Europe

ConceptDraw PRO is idea to draw the geological maps of Europe from the pre-designed vector geo map shapes.
Use it to draw thematic maps, geospatial infographics and vector illustrations for your business documents, presentations and websites.
Geo Map - Europe - Czech Republic

- Photo Sample Development Process Flow Chart
- Mass Communication Chart Sympol
- Flowchart Software | How To Create Restaurant Floor Plan in ...
- Flow Chart Symbol Photo
- Data Flow Diagram For Photo Editing Process
- How to Draw an Organization Chart | Top 5 Android Flow Chart ...
- How to Create a Social Media DFD Flowchart | Social Media ...
- Social Media Flowchart Symbols | Social Media Response | Audio ...
- Pie Chart Software | How to Create a Pie Chart | Social Media ...
- Telecommunication Network Diagrams | Design elements ...
- Contoh Flowchart | Synthetic object construction - Flowchart ...
- How to Create a Social Media DFD Flowchart | Communication ...
- Business Process Diagrams | Entity-Relationship Diagram (ERD ...
- Communication medium diagram | Diagramming Software for ...
- Social Media Flowchart Symbols | Network Diagramming Software ...
- Contoh Flowchart | Business diagrams & Org Charts with ...
- Social Media Response DFD Flowcharts - diagramming software ...
- UML Use Case Diagram Example Social Networking Sites Project ...
- How to Create a Social Media DFD Flowchart | Flowchart Example ...
- Design elements - Transmission paths | Bus Network Topology ...
- ERD | Entity Relationship Diagrams, ERD Software for Mac and Win
- Flowchart | Basic Flowchart Symbols and Meaning
- Flowchart | Flowchart Design - Symbols, Shapes, Stencils and Icons
- Flowchart | Flow Chart Symbols
- Electrical | Electrical Drawing - Wiring and Circuits Schematics
- Flowchart | Common Flowchart Symbols
- Flowchart | Common Flowchart Symbols