HelpDesk
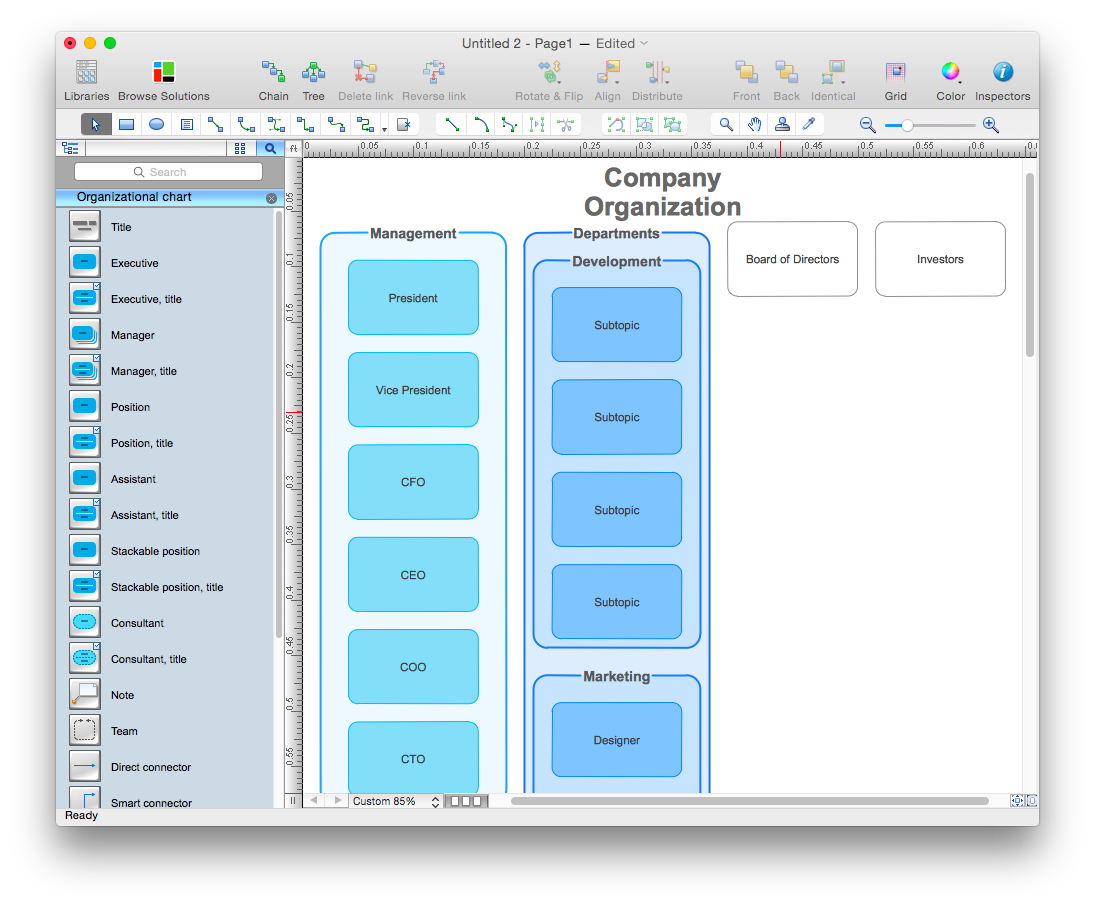
How to Create Organizational Chart Using Management Solution
Use ConceptDraw MINDMAP for generating structured data on organization structure and then ConceptDraw PRO for presenting the results as chart.
 Cross-Functional Flowcharts
Cross-functional flowcharts are powerful and useful tool for visualizing and analyzing complex business processes which requires involvement of multiple people, teams or even departments. They let clearly represent a sequence of the process steps, the order of operations, relationships between processes and responsible functional units (such as departments or positions).
HelpDesk
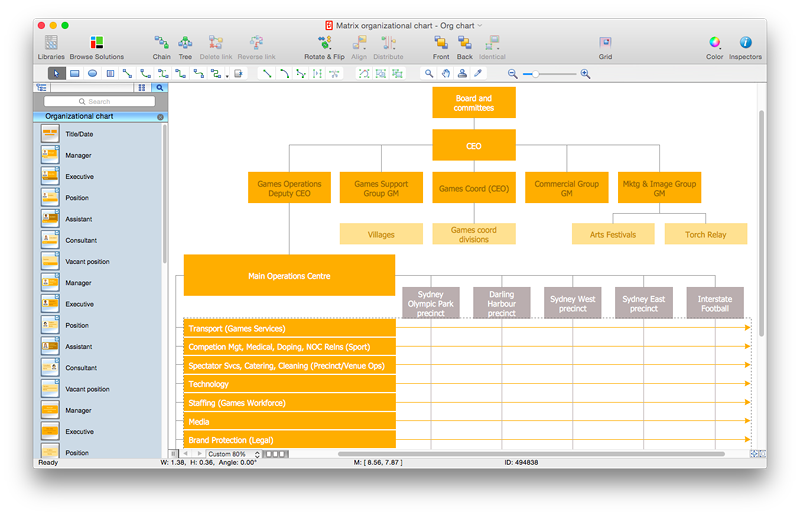
How to Draw a Matrix Organizational Chart with ConceptDraw PRO
There are a number of moments which are influenced on how the organizational structure of a certain business needs to be, how complex, and which type it should keep. The matrix organizational structure is atypical because it brings together employees and managers from different departments to work toward accomplishing a goal. This structure is commonly found in businesses that have more than one line of reportage. For instance, a company might contain an engineering department with engineering managers who workers report to. However, these workers might also have to liaise with different product or project managers depending on current tasks. Some form of matrix organization is found in most large-scale modern businesses. It is one of the most complicated reporting structures. You can easily build a clear matrix organizational chart in ConceptDraw PRO using templates from ConceptDraw Solution Park.HelpDesk
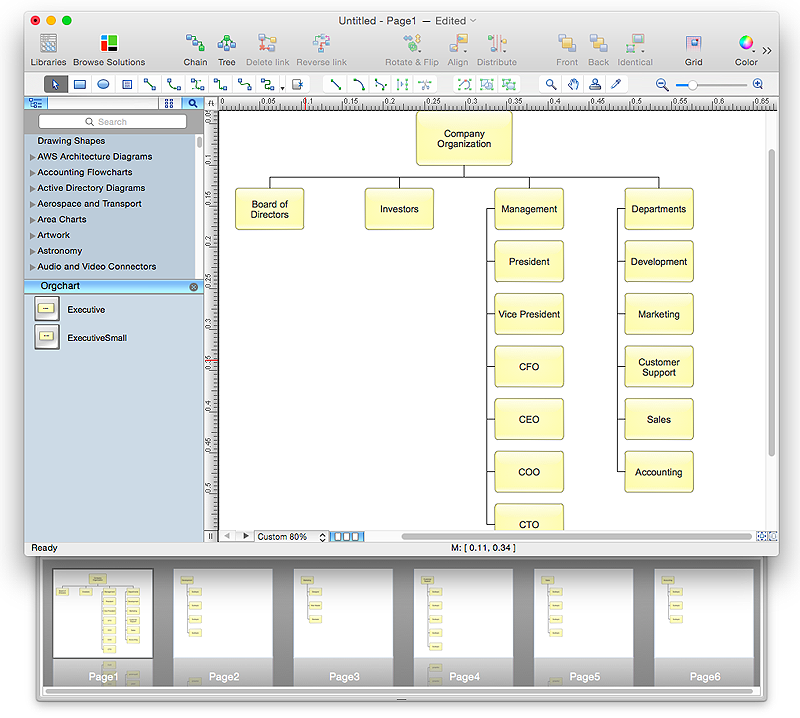
How to Create Organizational Chart Quickly
Use ConceptDraw MINDMAP for generating structured data on organization structure and then ConceptDraw PRO for presenting the results as chart.- Flow Chart Of Meetings Of A Company
- Example Of Basic Communication Meeting In Flowchart
- Sales Process Flowchart . Flowchart Examples | Cross-Functional ...
- Simple Flowchart Of Business Meeting
- Meeting Process Flow Chart
- Audit Steps | Process Flowchart | Business diagrams & Org Charts ...
- Flow Chart On Types Of Company Meetimgs
- Quality Mind Maps | Process Flowchart | Quality visualization in your ...
- Process Flowchart | Audit Steps | Audit Flowcharts | Diagram On ...
- Process Flowchart | Tool for Workgroup Briefings, Meetings and ...
- Charts Diagrams Of Meetings Of A Company
- TQM Diagram Example | Sales Dashboards for Your Company ...
- PM Meetings | Cross-Functional Flowchart | How to Prepare ...
- What Is A Diagram Meeting Agenda
- Flow Chart Diagram Of A Company From Call Center Industry Using
- Audit Process Flowchart . Audit Flowchart | Audit Steps | Auditing ...
- Quality visualization in your company | Mind Map - Quality Structure ...
- Process Flowchart | Competitor Analysis | Quality visualization in ...
- Process Flowchart | Organizational Structure | ConceptDraw PRO ...
- Flowchart Marketing Process. Flowchart Examples | Marketing ...
- ERD | Entity Relationship Diagrams, ERD Software for Mac and Win
- Flowchart | Basic Flowchart Symbols and Meaning
- Flowchart | Flowchart Design - Symbols, Shapes, Stencils and Icons
- Flowchart | Flow Chart Symbols
- Electrical | Electrical Drawing - Wiring and Circuits Schematics
- Flowchart | Common Flowchart Symbols
- Flowchart | Common Flowchart Symbols


