Using Fishbone Diagrams for Problem Solving

Using Fishbone Diagrams for Problem Solving is a productive and illustrative tool to identify the most important factors causing the trouble. ConceptDraw DIAGRAM extended with Fishbone Diagrams solution from the Management area of ConceptDraw Solution Park is a powerful tool for problem solving with Fishbone Ishikawa diagram graphic method.
Venn Diagram Examples for Problem Solving. Environmental Social Science. Human Sustainability Confluence

Create your Venn diagrams for problem solving in environmental social science using the ConceptDraw DIAGRAM diagramming and vector drawing software extended with the Venn Diagrams solution from the area "Diagrams" of ConceptDraw Solution Park.
 Fishbone Diagrams
The Fishbone Diagrams solution extends ConceptDraw DIAGRAM software with the ability to easily draw the Fishbone Diagrams (Ishikawa Diagrams) to clearly see the cause and effect analysis and also problem solving. The vector graphic diagrams produced using this solution can be used in whitepapers, presentations, datasheets, posters, and published technical material.
PROBLEM ANALYSIS. Root Cause Analysis Tree Diagram

ConceptDraw Office suite is a software for problem analysis.

 ConceptDraw Solution Park
ConceptDraw Solution Park collects graphic extensions, examples and learning materials
Best Value Stream Mapping mac Software

Business Diagram Software


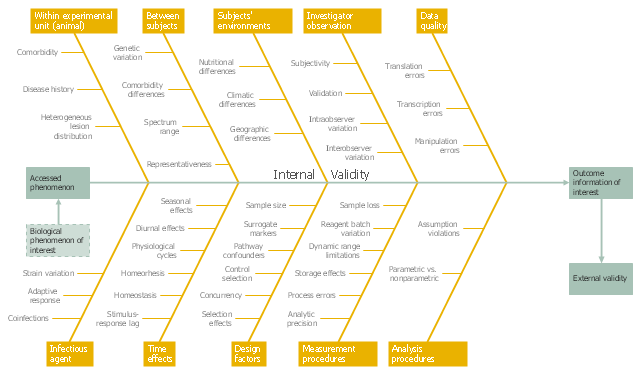
This example was created on the base of the figure from the website of the WSU College of Veterinary Medicine of the Washington State University. [vetmed.wsu.edu/ courses-jmgay/ images/ Ishikawa%20 Variance%20 Diagram.jpg]
"Internal validity is a property of scientific studies which reflects the extent to which a causal conclusion based on a study is warranted. Such warrant is constituted by the extent to which a study minimizes systematic error (or 'bias')." [Internal validity. Wikipedia]
The fishbone diagram example "Ishikawa variance diagram" was created using the ConceptDraw PRO diagramming and vector drawing software extended with the Fishbone Diagrams solution from the Management area of ConceptDraw Solution Park.
Ishikawa diagram
 Biology
Biology solution extends ConceptDraw DIAGRAM software with samples, templates and libraries containing biological vector symbols, to help you create scientific and educational designs in the field of biology.
 Chemistry
This solution extends ConceptDraw DIAGRAM software with samples, template and libraries of vector stencils for drawing the Chemistry Illustrations for science and education.
Export from ConceptDraw DIAGRAM Document to MS Visio® XML

Now you can share your ConceptDraw documents with MS Visio users.

 Astronomy
Astronomy solution extends ConceptDraw DIAGRAM software with illustration and sketching software with templates, samples and libraries of a variety of astronomy symbols, including constellations, galaxies, stars, and planet vector shapes; a whole host of cele
 Fault Tree Analysis Diagrams
This solution extends ConceptDraw DIAGRAM.5 or later with templates, fault tree analysis example, samples and a library of vector design elements for drawing FTA diagrams (or negative analytical trees), cause and effect diagrams and fault tree diagrams.
- Fishbone Science Example
- Fishbone Problem Solving | Venn Diagram Examples for Problem ...
- Fishbone Diagram Science Examples In Science
- Physics Diagrams | Mathematical Diagrams | Business Productivity ...
- Biology | Language Learning | Chemistry | Fishbone Diagram Science
- Fishbone Diagram Lab Values
- Fishbone Diagram Labs
- Fishbone Diagrams | Biology | ConceptDraw Solution Park ...
- Fish Bone In Science
- Lab Diagram Fishbone
- Fishbone Lab Diagram Template
- Fishbone Diagram | Fishbone Diagrams | How to Draw a Fishbone ...
- Education | Language Learning | Science and Education Area ...
- Business Productivity Diagramming | Venn Diagram Examples for ...
- Chemistry Fishbone Diagram
- Fishbone Diagrams | Venn Diagram Examples for Problem Solving ...
- Physics Diagrams | Business Productivity Diagramming | Fishbone ...
- Using Fishbone Diagrams for Problem Solving | Cause and Effect ...
- Fishbone Diagrams | Fault Tree Analysis Diagrams | ConceptDraw ...
- Education | Fishbone Diagram | Education Mind Maps | Education ...
- ERD | Entity Relationship Diagrams, ERD Software for Mac and Win
- Flowchart | Basic Flowchart Symbols and Meaning
- Flowchart | Flowchart Design - Symbols, Shapes, Stencils and Icons
- Flowchart | Flow Chart Symbols
- Electrical | Electrical Drawing - Wiring and Circuits Schematics
- Flowchart | Common Flowchart Symbols
- Flowchart | Common Flowchart Symbols