Sales KPI Dashboards

 Fishbone Diagrams
The Fishbone Diagrams solution extends ConceptDraw DIAGRAM software with the ability to easily draw the Fishbone Diagrams (Ishikawa Diagrams) to clearly see the cause and effect analysis and also problem solving. The vector graphic diagrams produced using this solution can be used in whitepapers, presentations, datasheets, posters, and published technical material.
Fishbone Diagram Procedure

Example of DFD for Online Store (Data Flow Diagram)

Example of DFD for Online Store shows the Data Flow Diagram for online store and interactions between the Visitors, Customers and Sellers, as well as Website Information and User databases.

Sales Performance
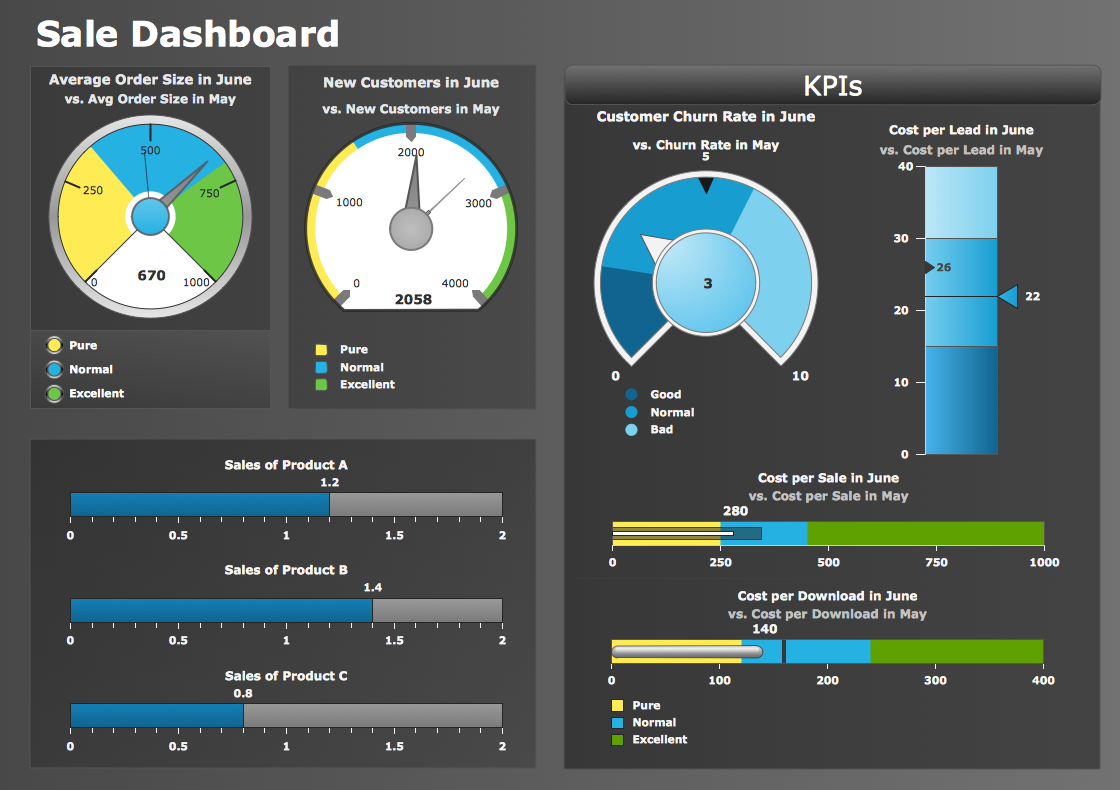
Sales Dashboard - insight about potential opportunities and key sales operations

The Facts and KPIs

Sales Dashboards for Your Company
Sales Dashboard Solutions can help your sales team keep an eye on performance

Online Collaboration via Skype


TQM Diagram Tool

 Sales Dashboard
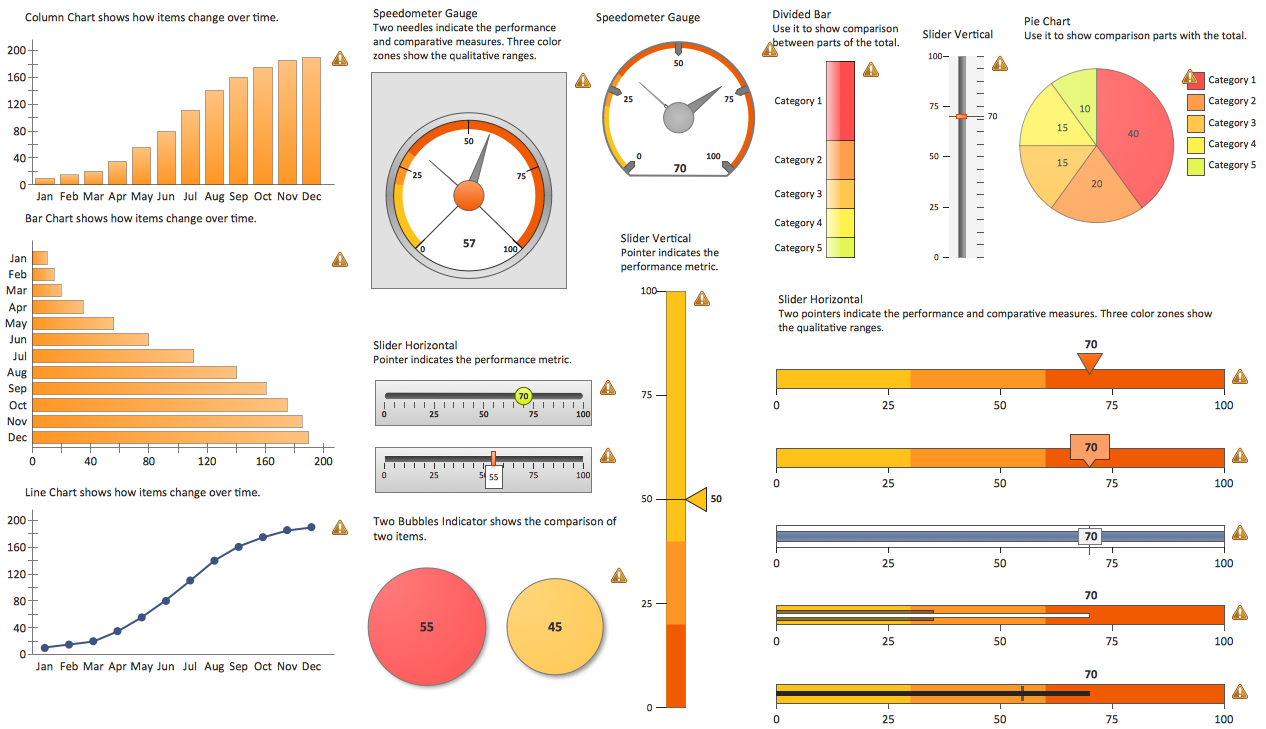
Sales Dashboard solution extends ConceptDraw DIAGRAM software with templates, samples and library of vector stencils for drawing the visual dashboards of sale metrics and key performance indicators (KPI).
 Sales Flowcharts
The Sales Flowcharts solution lets you create and display sales process maps, sales process workflows, sales steps, the sales process, and anything else involving sales process management.
KPI Dashboard

 Fishbone Diagram
Fishbone Diagrams solution extends ConceptDraw DIAGRAM software with templates, samples and library of vector stencils for drawing the Ishikawa diagrams for cause and effect analysis.
- Fishbone Diagrams | Sales KPI Dashboards | Example of DFD for ...
- Fishbone Diagrams | Example of DFD for Online Store (Data Flow ...
- Fishbone Diagram | Sales Dashboard | Fishbone Diagrams ...
- Fishbone Diagrams | Sales Dashboard | Six Markets Model Chart ...
- Fishbone Of Low Sales
- Fishbone Diagram Sample For Sales Marketing
- Fishbone Diagram For Sales Performance
- Fishbone Diagram | Sales KPI Dashboards | Fishbone Diagrams ...
- Fish Bone Diagram For Sales Decreased
- Sales Process Flowchart Symbols | Sales Flowcharts | Draw ...
- Sales Flowcharts | Business Process Diagrams | Process Flowchart ...
- Fishbone Diagram | Fishbone Diagram Problem Solving | Sales KPI ...
- Fishbone Diagram | Sales KPI Dashboards | ConceptDraw Solution ...
- Fishbone Diagrams | Fishbone Diagram | Health Food | Fish Rack ...
- Sales Flowcharts | Competitor Analysis | Fishbone Diagrams | Iso ...
- Fishbone Diagram | Star Network Topology | Entity-Relationship ...
- Marketing - Design Elements | Fishbone Diagrams | Sales symbols ...
- Fishbone Diagrams | Example of DFD for Online Store (Data Flow ...
- Fishbone Diagram | Health Food | Sales Flowcharts | Fish Body ...
- Fishbone Diagrams | Sales Dashboard | Pyramid Diagrams ...
- ERD | Entity Relationship Diagrams, ERD Software for Mac and Win
- Flowchart | Basic Flowchart Symbols and Meaning
- Flowchart | Flowchart Design - Symbols, Shapes, Stencils and Icons
- Flowchart | Flow Chart Symbols
- Electrical | Electrical Drawing - Wiring and Circuits Schematics
- Flowchart | Common Flowchart Symbols
- Flowchart | Common Flowchart Symbols