 Fishbone Diagram
Fishbone Diagrams solution extends ConceptDraw PRO software with templates, samples and library of vector stencils for drawing the Ishikawa diagrams for cause and effect analysis.
Fishbone Problem Solving

ConceptDraw PRO diagramming and vector drawing software extended with Fishbone Diagrams Solution from the Management Area of ConceptDraw Solution Park is a powerful Fishbone Problem Solving tool.
 Fishbone Diagrams
The Fishbone Diagrams solution extends ConceptDraw PRO v10 software with the ability to easily draw the Fishbone Diagrams (Ishikawa Diagrams) to clearly see the cause and effect analysis and also problem solving. The vector graphic diagrams produced using this solution can be used in whitepapers, presentations, datasheets, posters, and published technical material.
This example was created on the base of the figure from the website of Minnesota Department of Health. [health.state.mn.us/ divs/ opi/ qi/ images/ fishbone_ ex.png]
"Minnesota’s Health Alert Network (HAN) enables public health staff, tribal governments, health care providers, emergency workers, and others working to protect the public to exchange information during a disease outbreak, environmental threat, natural disaster, or act of terrorism." [health.state.mn.us/ han/ ]
The fishbone diagram example "HAN project" was created using the ConceptDraw PRO diagramming and vector drawing software extended with the Fishbone Diagrams solution from the Management area of ConceptDraw Solution Park.
Ishikawa diagram

Fishbone Diagram

ConceptDraw PRO supplied with Fishbone Diagrams solution from the Management area is the best software for fast and easy drawing professional looking Fishbone Diagram.
Export from ConceptDraw PRO Document to a Graphic File

ConceptDraw PRO can save your drawings and diagrams in a number of highly useful formats, including graphic files. You can save your drawing as a .PNG, .JPG, or other graphic format file.

 ConceptDraw Solution Park
ConceptDraw Solution Park collects graphic extensions, examples and learning materials
 Vehicular Networking
Network engineering is an extensive area with wide range of applications. Depending to the field of application, network engineers design and realize small networks or complex networks, which cover wide territories. In latter case will be ideal recourse to specialized drawing software, such as ConceptDraw PRO.
Recruitment

The recruitment process often requires design and use of various HR flowcharts, diagrams, attractive illustrations. Never before their creation wasn’t so easy as now with HR Flowcharts Solution from the Management Area of ConceptDraw Solution Park.
 Picture Graphs
Picture Graphs solution extends ConceptDraw PRO software with templates, samples and library of vector stencils for drawing the picture charts.
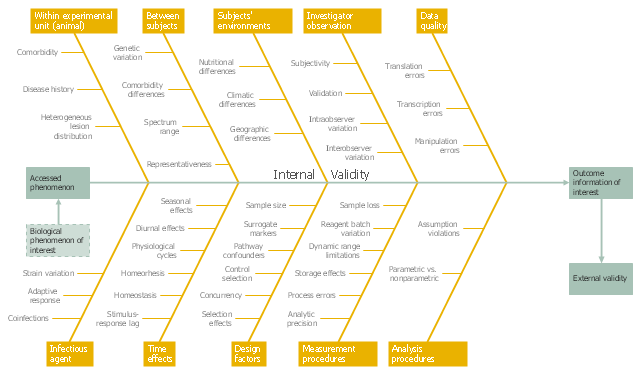
This example was created on the base of the figure from the website of the WSU College of Veterinary Medicine of the Washington State University. [vetmed.wsu.edu/ courses-jmgay/ images/ Ishikawa%20 Variance%20 Diagram.jpg]
"Internal validity is a property of scientific studies which reflects the extent to which a causal conclusion based on a study is warranted. Such warrant is constituted by the extent to which a study minimizes systematic error (or 'bias')." [Internal validity. Wikipedia]
The fishbone diagram example "Ishikawa variance diagram" was created using the ConceptDraw PRO diagramming and vector drawing software extended with the Fishbone Diagrams solution from the Management area of ConceptDraw Solution Park.
Ishikawa diagram
 Management
This solution extends ConceptDraw PRO v9 and ConceptDraw MINDMAP v7 with Management Diagrams and Mind Maps (decision making, scheduling, thinking ideas, problem solving, business planning, company organizing, SWOT analysis, preparing and holding meetings
- Images Of Fishbone Diagram
- Fishbone Diagrams | Diagramming Software for UML Composite ...
- Fishbone Diagrams | Image Enhancement Dfd Diagram
- Value Stream Mapping | Fishbone Diagram | Computer and ...
- Value Stream Mapping | Fishbone Diagram | Metro Map | Image ...
- Image Of Fishbone Diagram
- Fishbone Diagram | Management | PM Response | Fish Bone ...
- Vector Image For Safety Poster
- Fishbone Diagram | Entity-Relationship Diagram (ERD) | Business ...
- Manufacturing Pictures Diagram
- Fishbone Diagram | Total Quality Management TQM Diagrams ...
- Business Process Diagram | Fishbone Diagram | Business Process ...
- Fishbone Diagram | Entity-Relationship Diagram (ERD) | Value ...
- Picture Showing Fishbone Diagram In Tqm
- Image Swot Analysis
- Basic Flowchart Images . Flowchart Examples | How to Draw a ...
- Fishbone Diagrams | ConceptDraw Solution Park | Biology ...
- Biology | Fishbone Analysis In Biochemistry
- Biology | Fishbone Analysis In Biochemustry
- Manufacturing and Maintenance | Picture Graphs | Types of ...
- ERD | Entity Relationship Diagrams, ERD Software for Mac and Win
- Flowchart | Basic Flowchart Symbols and Meaning
- Flowchart | Flowchart Design - Symbols, Shapes, Stencils and Icons
- Flowchart | Flow Chart Symbols
- Electrical | Electrical Drawing - Wiring and Circuits Schematics
- Flowchart | Common Flowchart Symbols
- Flowchart | Common Flowchart Symbols