 Fishbone Diagrams
The Fishbone Diagrams solution extends ConceptDraw DIAGRAM software with the ability to easily draw the Fishbone Diagrams (Ishikawa Diagrams) to clearly see the cause and effect analysis and also problem solving. The vector graphic diagrams produced using this solution can be used in whitepapers, presentations, datasheets, posters, and published technical material.
Competitor Analysis

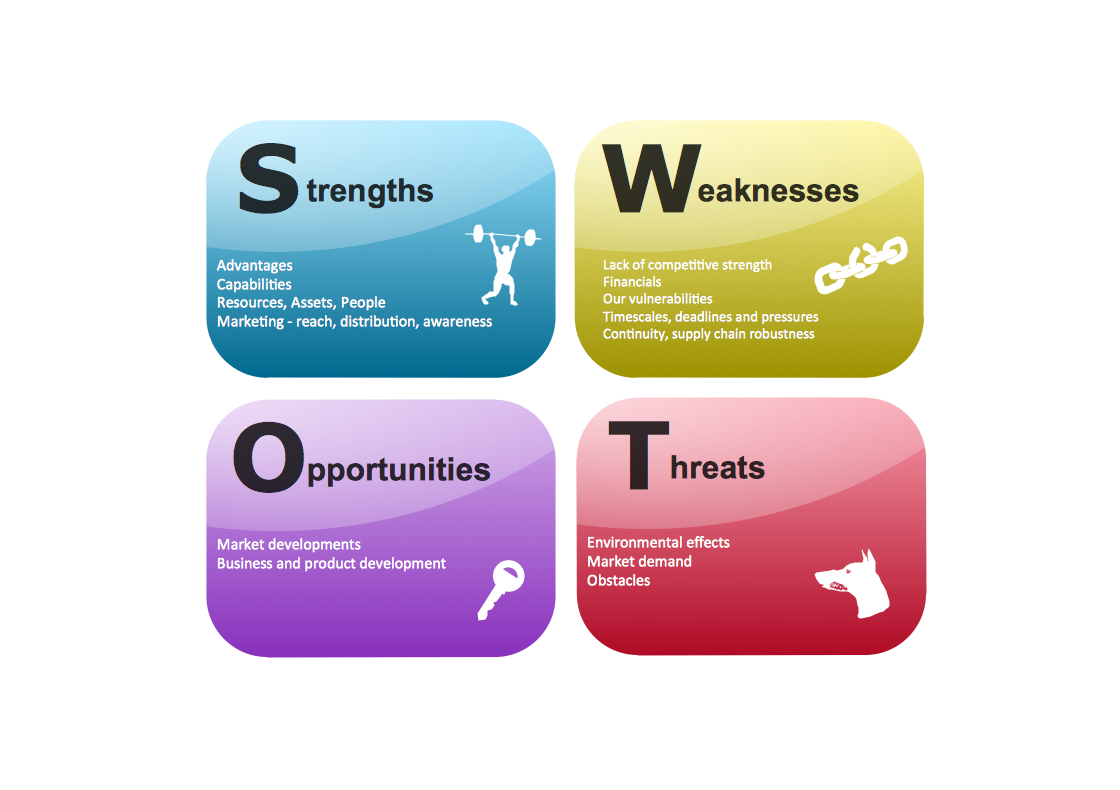
SWOT Analysis

When To Use a Fishbone Diagram

When to use a Fishbone diagram? Originally developed as a quality control tool, you may find a Fishbone diagram helpful when used in many cases, such as to analyze a complex problem when there are many causes, for identifying all possible root causes for an effect or a problem, when you need different point of view to look on a problem, to uncover bottlenecks and identify where and why a process doesn't work, for acceleration a process when traditional ways of problem solving consume many time.
Fishbone Diagram Example

Fishbone Diagrams solution included to ConceptDraw Solution Park contains powerful drawing tools and a lot of examples, samples and templates. Each Fishbone diagram example is carefully thought-out by experts and is perfect source of inspiration for you.
Organizational Structure Types

ConceptDraw DIAGRAM diagramming and vector drawing software enhanced with 25 Typical Orgcharts solution from the Management area of ConceptDraw Solution Park is ideal for designing diagrams and charts of any organizational structure types.
 Target and Circular Diagrams
This solution extends ConceptDraw DIAGRAM software with samples, templates and library of design elements for drawing the Target and Circular Diagrams.
 Network Security Diagrams
The Network Security Diagrams solution presents a large collection of predesigned cybersecurity vector stencils, cliparts, shapes, icons and connectors to help you succeed in designing professional and accurate Network Security Diagrams, Network Security Infographics to share knowledge about effective ways of networks protection with help of software and network security devices of different cyber security degrees, Network Plans for secure wireless network, Computer Security Diagrams to visually tell about amazing possibilities of IT security solutions. The samples and examples reflect the power of ConceptDraw DIAGRAM software in drawing Network Security Diagrams, give the representation about variety of existing types of attacks and threats, help to realize their seriousness and the methods to deal with them.
 Seven Basic Tools of Quality
Manage quality control in the workplace, using fishbone diagrams, flowcharts, Pareto charts and histograms, provided by the Seven Basic Tools of Quality solution.
 Block Diagrams
Block diagrams solution extends ConceptDraw DIAGRAM software with templates, samples and libraries of vector stencils for drawing the block diagrams.
SWOT Matrix Software

 SWOT and TOWS Matrix Diagrams
SWOT and TOWS Matrix Diagrams solution extends ConceptDraw DIAGRAM and ConceptDraw MINDMAP software with features, templates, samples and libraries of vector stencils for drawing SWOT and TOWS analysis matrices and mind maps.
SWOT Template
SWOT Matrix Template

Organogram Software

- Ishikawa Diagram | How to Create a Fishbone ( Ishikawa ) Diagram ...
- Process Flowchart | Data Flow Diagram Model | Manufacturing 8 Ms ...
- Fishbone Diagram Poor Quality Of Product
- Ishikawa Diagram | Fishbone Diagram Example | Ishikawa fishbone ...
- Target diagrams - Vector stencils library | Target diagrams - Vector ...
- Manufacturing 8 Ms fishbone diagram - Template | How Do ...
- Service 8 Ps fishbone diagram - Template | Fishbone Diagrams ...
- Fault Tree Analysis Diagrams | PROBLEM ANALYSIS. Root Cause ...
- Fish Bone For Environment Process
- Swot Analysis For Business Development Department
- Environment Diagrams
- Fishbone diagram - HAN project | Relations diagram - Health care ...
- Fishbone Diagrams | Ishikawa Diagram | Cause and Effect Analysis ...
- Cause and Effect Analysis - Fishbone Diagrams for Problem Solving ...
- SWOT Analysis | SWOT Matrix | SWOT and TOWS Matrix Diagrams ...
- Venn Diagram Examples for Problem Solving. Environmental Social ...
- Fishbone Diagram | Fishbone Diagrams | Improving Problem ...
- Cause And Effect Analysis Fishbone Diagram Management Pdf
- Flowchart on Bank. Flowchart Examples | Fishbone Diagrams | Bus ...
- Using Fishbone Diagrams for Problem Solving | Fishbone Diagram ...
- ERD | Entity Relationship Diagrams, ERD Software for Mac and Win
- Flowchart | Basic Flowchart Symbols and Meaning
- Flowchart | Flowchart Design - Symbols, Shapes, Stencils and Icons
- Flowchart | Flow Chart Symbols
- Electrical | Electrical Drawing - Wiring and Circuits Schematics
- Flowchart | Common Flowchart Symbols
- Flowchart | Common Flowchart Symbols