 Fishbone Diagrams
The Fishbone Diagrams solution extends ConceptDraw DIAGRAM software with the ability to easily draw the Fishbone Diagrams (Ishikawa Diagrams) to clearly see the cause and effect analysis and also problem solving. The vector graphic diagrams produced using this solution can be used in whitepapers, presentations, datasheets, posters, and published technical material.
Create Fishbone Diagrams with the ConceptDraw

Ishikawa Diagram

ConceptDraw DIAGRAM diagramming and vector drawing software extended with Fishbone Diagrams solution from the Management area can help you with construction the Fishbone Diagram also known as Ishikawa Diagram.
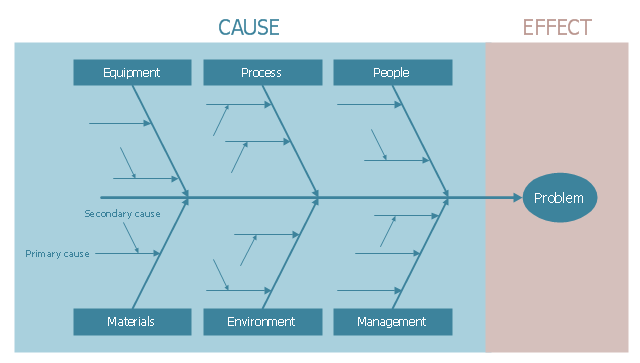
Ishikawa Diagram shows factors of Equipment, Process, People, Materials, Environment and Management, all affecting the overall problem in one drawing for the further analysis. It is a well effective way to analyze the business problems you must identify and solve.
This example was created on the base of the figure from the website of the Iowa State University Center for Excellence in Learning and Teaching.
"Fishbone.
What: The fishbone technique uses a visual organizer to identify the possible causes of a problem.
Benefits: This technique discourages partial or premature solutions and demonstrates the relative importance of, and interactions between, different parts of a problem.
How: On a broad sheet of paper, draw a long arrow horizontally across the middle of the page pointing to the right. Label the arrowhead with the title of the issue to be explained. This is the "backbone" of the "fish." Draw "spurs" from this "backbone" at about 45 degrees, one for every likely cause of the problem that the group can think of; and label each. Sub-spurs can represent subsidiary causes. The group considers each spur/ sub-spur, taking the simplest first, partly for clarity but also because a simple explanation may make more complex ones unnecessary. Ideally, the fishbone is redrawn so that position along the backbone reflects the relative importance of the different parts of the problem, with the most important at the head." [celt.iastate.edu/ creativity/ techniques.html]
The fishbone diagram example "Inability to meet project deadlines" was created using the ConceptDraw PRO diagramming and vector drawing software extended with the Fishbone Diagrams solution from the Management area of ConceptDraw Solution Park.
Ishikawa diagram

Cause and Effect Fishbone Diagram

Now the problem of complexity the Cause and Effect Fishbone Diagram creating is solved thanks to the ConceptDraw DIAGRAM diagramming and vector drawing software extended with Fishbone Diagrams solution from the Management area.
Wireframing
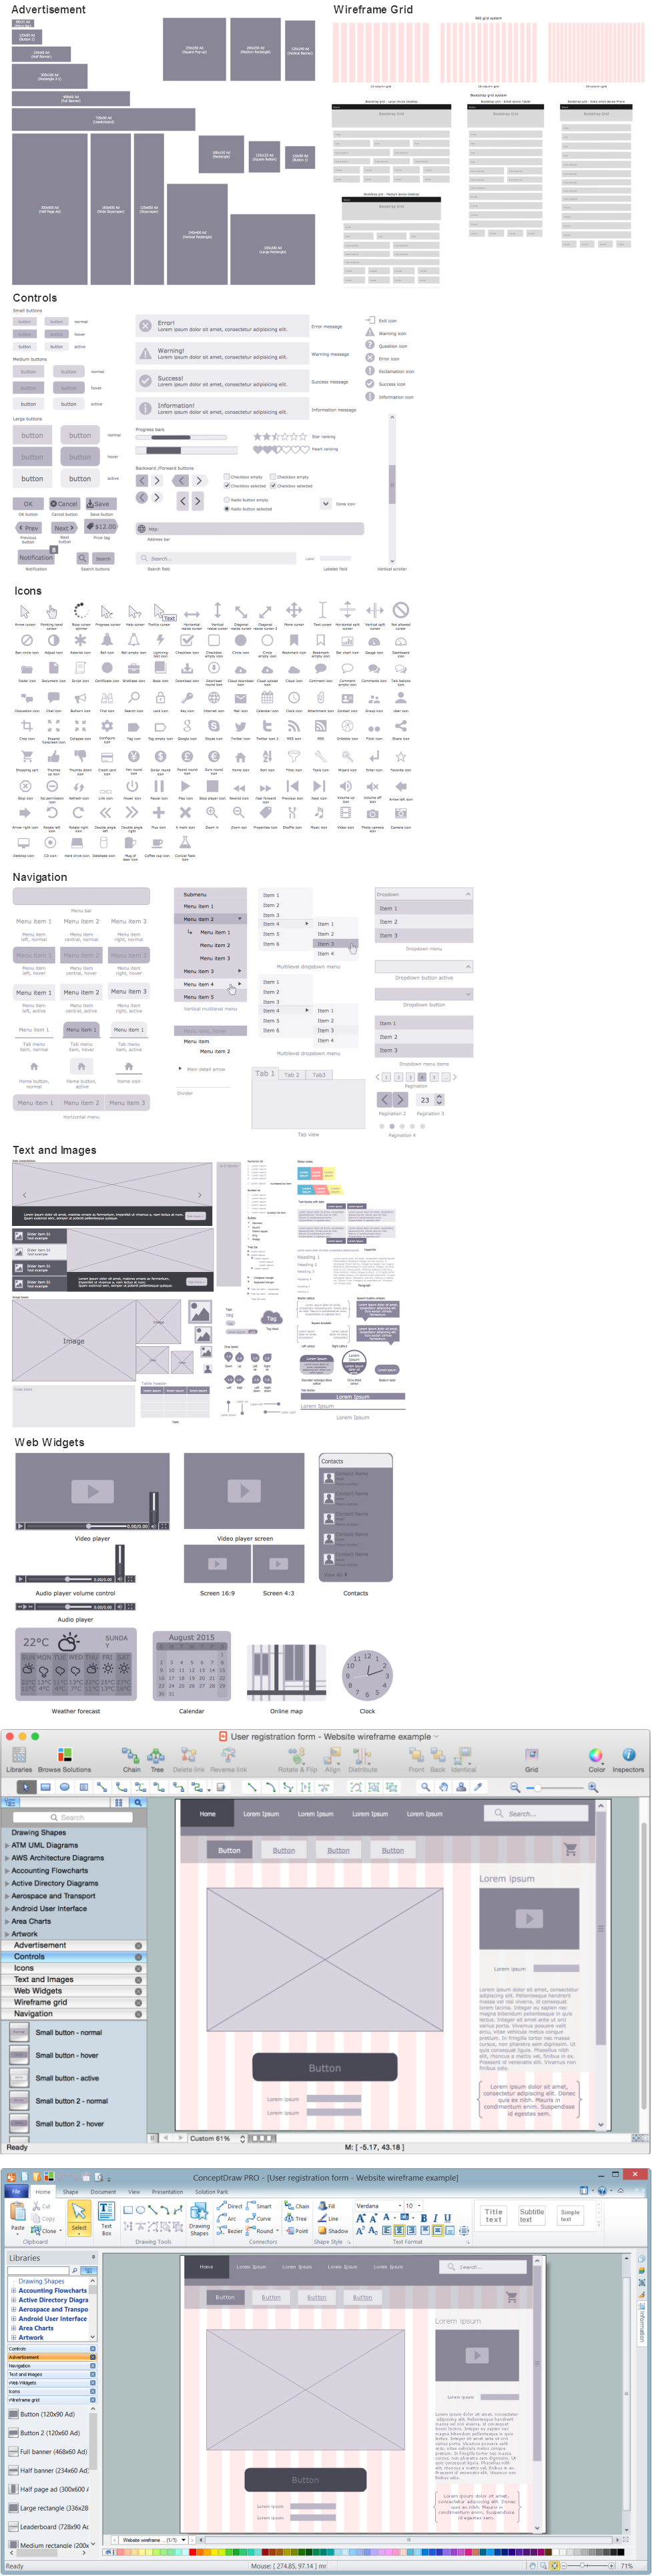
ConceptDraw DIAGRAM extended with Website Wireframe solution from the Software Development area is the best wireframing software. Using the wireframe tools, libraries of vector objects, template and examples which offers a Website Wireframe solution, you will easily design the websites wireframes of any complexity.
This example was created on the base of the figure from the website of Minnesota Department of Health. [health.state.mn.us/ divs/ opi/ qi/ images/ fishbone_ ex.png]
"Minnesota’s Health Alert Network (HAN) enables public health staff, tribal governments, health care providers, emergency workers, and others working to protect the public to exchange information during a disease outbreak, environmental threat, natural disaster, or act of terrorism." [health.state.mn.us/ han/ ]
The fishbone diagram example "HAN project" was created using the ConceptDraw PRO diagramming and vector drawing software extended with the Fishbone Diagrams solution from the Management area of ConceptDraw Solution Park.
Ishikawa diagram

 AWS Architecture Diagrams
AWS Architecture Diagrams with powerful drawing tools and numerous predesigned Amazon icons and AWS simple icons is the best for creation the AWS Architecture Diagrams, describing the use of Amazon Web Services or Amazon Cloud Services, their application for development and implementation the systems running on the AWS infrastructure. The multifarious samples give you the good understanding of AWS platform, its structure, services, resources and features, wide opportunities, advantages and benefits from their use; solution’s templates are essential and helpful when designing, description and implementing the AWS infrastructure-based systems. Use them in technical documentation, advertising and marketing materials, in specifications, presentation slides, whitepapers, datasheets, posters, etc.
Flowchart Definition

This cause-and-effect diagram example was redesigned from the Wikimedia Commons file: Ishikawa Fishbone Diagram.svg. [commons.wikimedia.org/ wiki/ File:Ishikawa_ Fishbone_ Diagram.svg]
"Ishikawa diagrams (also called fishbone diagrams, herringbone diagrams, cause-and-effect diagrams, or Fishikawa) are causal diagrams created by Kaoru Ishikawa (1968) that show the causes of a specific event. Common uses of the Ishikawa diagram are product design and quality defect prevention to identify potential factors causing an overall effect. Each cause or reason for imperfection is a source of variation. Causes are usually grouped into major categories to identify these sources of variation. The categories typically include
- People: Anyone involved with the process
- Methods: How the process is performed and the specific requirements for doing it, such as policies, procedures, rules, regulations and laws
- Machines: Any equipment, computers, tools, etc. required to accomplish the job
- Materials: Raw materials, parts, pens, paper, etc. used to produce the final product
- Measurements: Data generated from the process that are used to evaluate its quality
- Environment: The conditions, such as location, time, temperature, and culture in which the process operates" [Ishikawa diagram. Wikipedia]
The example "Ishikawa fishbone diagram" was created using the ConceptDraw PRO software extended with the Seven Basic Tools of Quality solution from the Quality area of ConceptDraw Solution Park.
Cause-and-effect diagram example
- Fishbone diagram - HAN project | Cross-Functional Flowcharts | The ...
- Fishbone Diagram | Process Flowchart | Example of DFD for Online ...
- AWS Architecture Diagrams | Fishbone Diagram | Network Diagram ...
- Fishbone Diagrams | Component Diagram Of Estate Website
- Fishbone Diagram Problem Solving | Using Fishbone Diagrams for ...
- Cause and Effect Analysis | Fault Tree Diagram | Using Fishbone ...
- Enterprise Architecture Diagrams | How to Draw a Fishbone ...
- Fishbone Diagrams | Cafe and Restaurant Floor Plans | Fishbone ...
- Fishbone diagram - HAN project | Causes And Effects Of Terrorism
- Fishbone Diagram Problem Solving | Fishbone Diagrams ...
- ERD | Entity Relationship Diagrams, ERD Software for Mac and Win
- Flowchart | Basic Flowchart Symbols and Meaning
- Flowchart | Flowchart Design - Symbols, Shapes, Stencils and Icons
- Flowchart | Flow Chart Symbols
- Electrical | Electrical Drawing - Wiring and Circuits Schematics
- Flowchart | Common Flowchart Symbols
- Flowchart | Common Flowchart Symbols