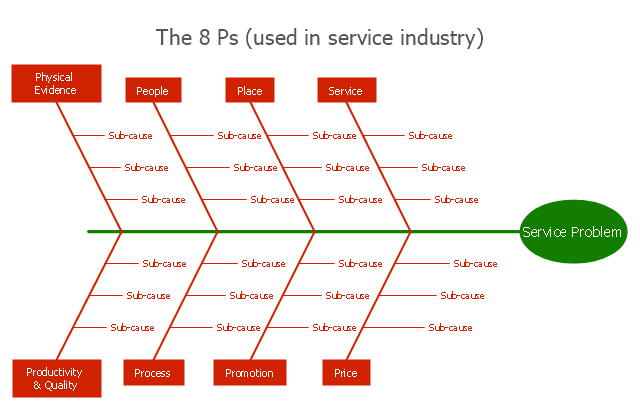
"Causes in the diagram are often categorized, such as to ...
The 7 Ps (used in marketing industry):
(1) Product/ Service;
(2) Price;
(3) Place;
(4) Promotion;
(5) People/ personnel;
(6) Positioning;
(7) Packaging. " [Ishikawa diagram. Wikipedia]
This 8 Ps Ishikawa diagram (service cause and effect diagram) template is included in the Fishbone Diagram solution from the Management area of ConceptDraw Solution Park.
Personal area (PAN) networks. Computer and Network Examples
A Personal area network (PAN) is a computer network that is used for data transmission between different personal devices (computers, telephones, digital devices, etc.) and for connecting to the higher level network and Internet. PANs can be wired with computer buses (USB and FireWire). A wireless personal area network (WPAN) can be made using the network technologies such as Bluetooth, IrDa, UWB, Z-Wave, ZigBee, Body Area Network. A personal area network handles the interconnection of IT devices at the surrounding of a single user. Generally, PAN contains from following such appliances: cordless mice and keyboards, cordless phone, Bluetooth handsets.This example was created in ConceptDraw PRO using the Computer and Networks Area of ConceptDraw Solution Park and shows the Personal area network.

Venn Diagram Examples for Problem Solving
In the Venn Diagrams solution, there are the pre-made examples that can be always used for making the unique, great looking diagrams, such as the 2-set Venn ones of any needed colour, the 3-set one, the 4-set ones and the 5-set ones. Having the already previously created samples of the Venn diagrams can help any ConceptDraw PRO user make it possible to make the needed drawing within only a few minutes by editing the existing ones.Process Flowchart
ConceptDraw is Professional business process mapping software for making process flow diagram, workflow diagram, general flowcharts and technical illustrations for business documents. It is includes rich examples, templates, process flowchart symbols. ConceptDraw flowchart maker allows you to easier create a process flowchart. Use a variety of drawing tools, smart connectors, flowchart symbols and shape libraries to create flowcharts of complex processes, process flow diagrams, procedures and information exchange.
 Entity-Relationship Diagram (ERD)
Entity-Relationship Diagram (ERD) solution extends ConceptDraw PRO software with templates, samples and libraries of vector stencils from drawing the ER-diagrams by Chen's and crow’s foot notations.
 Sales Flowcharts
The Sales Flowcharts solution lets you create and display sales process maps, sales process workflows, sales steps, the sales process, and anything else involving sales process management.
 Frequency Distribution Dashboard
Frequency distribution dashboard solution extends ConceptDraw PRO software with samples, templates and vector stencils libraries with histograms and area charts for drawing the visual dashboards showing frequency distribution of data.
 Time Series Dashboard
Time series dashboard solution extends ConceptDraw PRO software with templates, samples and vector stencils libraries with charts, graphs and plots for drawing the visual dashboards showing data time series.
 Correlation Dashboard
Correlation dashboard solution extends ConceptDraw PRO software with samples, templates and vector stencils library with Scatter Plot Charts for drawing the visual dashboard visualizing data correlation.
 Composition Dashboard
Composition dashboard solution extends ConceptDraw PRO software with templates, samples and vector stencils library with charts and indicators for drawing visual dashboards showing data composition.
 Comparison Dashboard
Comparison dashboard solution extends ConceptDraw PRO software with samples, templates and vector stencils library with charts and indicators for drawing the visual dashboard comparing data.
- Fishbone Diagram 4 P
- 4 PS Fishbone Diagram
- Service 8 Ps fishbone diagram - Template | SWOT analysis for a ...
- Service 8 Ps fishbone diagram - Template | Create Fishbone ...
- 4 P Diagram
- Service 8 Ps fishbone diagram - Template | How Do Fishbone ...
- Service 8 Ps fishbone diagram - Template | Fishbone Diagram ...
- Fishbone Diagrams | Fishbone Diagram | How Do Fishbone ...
- Fishbone Diagram Example For Service Industry
- Fishbone Diagram | Fishbone Diagrams | Service 4 Ss fishbone ...
- Fishbone Diagram 4 Ps
- Cause and Effect Diagrams | Cause and Effect Analysis - Fishbone ...
- Marketing mix diagram | How to Split a Complex Map to a Few ...
- Create Fishbone Diagrams with the ConceptDraw | Fishbone ...
- Flow chart Example. Warehouse Flowchart | Accounting Flowcharts ...
- Flow chart Example. Warehouse Flowchart | Conceptual diagram of ...
- Process Flowchart | Types of Flowcharts | Fishbone Diagram ...
- Venn Diagram Template for Word | Venn Diagrams | Venn Diagram ...
- Mind Map In P
- Ishikawa Diagram High Prices
- ERD | Entity Relationship Diagrams, ERD Software for Mac and Win
- Flowchart | Basic Flowchart Symbols and Meaning
- Flowchart | Flowchart Design - Symbols, Shapes, Stencils and Icons
- Flowchart | Flow Chart Symbols
- Electrical | Electrical Drawing - Wiring and Circuits Schematics
- Flowchart | Common Flowchart Symbols
- Flowchart | Common Flowchart Symbols


