 Fishbone Diagram
Fishbone Diagrams solution extends ConceptDraw PRO software with templates, samples and library of vector stencils for drawing the Ishikawa diagrams for cause and effect analysis.
HelpDesk
How to Draw a Fishbone Diagram with ConceptDraw PRO

"Causes in the diagram are often categorized, such as to ...
The 7 Ps (used in marketing industry):
(1) Product/ Service;
(2) Price;
(3) Place;
(4) Promotion;
(5) People/ personnel;
(6) Positioning;
(7) Packaging. " [Ishikawa diagram. Wikipedia]
This 8 Ps Ishikawa diagram (service cause and effect diagram) template is included in the Fishbone Diagram solution from the Management area of ConceptDraw Solution Park.
8Ps fishbone diagram

"Cause-and-effect diagrams can reveal key relationships among various variables, and the possible causes provide additional insight into process behavior.
Causes can be derived from brainstorming sessions. These groups can then be labeled as categories of the fishbone. They will typically be one of the traditional categories mentioned above but may be something unique to the application in a specific case. Causes can be traced back to root causes with the 5 Whys technique." [Ishikawa diagram. Wikipedia]
"The 5 Whys is an iterative question-asking technique used to explore the cause-and-effect relationships underlying a particular problem. The primary goal of the technique is to determine the root cause of a defect or problem. (The "5" in the name derives from an empirical observation on the number of iterations typically required to resolve the problem.)" [5 Whys. Wikipedia]
This Ishikawa diagram (cause and effect diagram) template is included in the Fishbone Diagram solution from the Management area of ConceptDraw Solution Park.
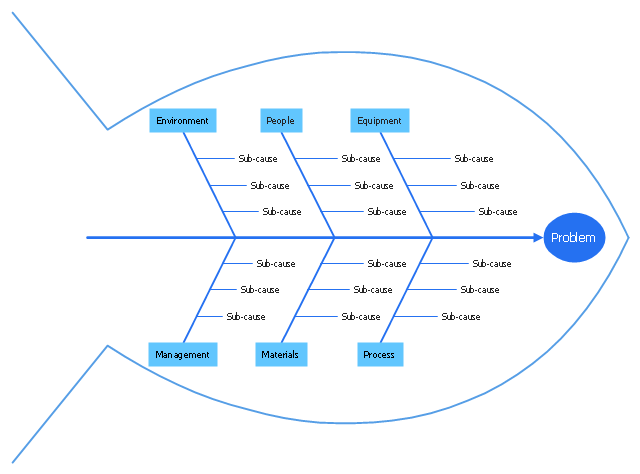
Fishbone diagram

"Common uses of the Ishikawa diagram are product design and quality defect prevention, to identify potential factors causing an overall effect. Each cause or reason for imperfection is a source of variation. Causes are usually grouped into major categories to identify these sources of variation. The categories typically include:
(1) People: Anyone involved with the process;
(2) Methods: How the process is performed and the specific requirements for doing it, such as policies, procedures, rules, regulations and laws;
(3) Machines: Any equipment, computers, tools, etc. required to accomplish the job;
(4) Materials: Raw materials, parts, pens, paper, etc. used to produce the final product;
(5) Measurements: Data generated from the process that are used to evaluate its quality;
(6) Environment: The conditions, such as location, time, temperature, and culture in which the process operates. ...
Ishikawa diagrams were popularized by Kaoru Ishikawa in the 1960s, who pioneered quality management processes in the Kawasaki shipyards, and in the process became one of the founding fathers of modern management.
The basic concept was first used in the 1920s, and is considered one of the seven basic tools of quality control." [Ishikawa diagram. Wikipedia]
This quality Ishikawa diagram (cause and effect diagram) template is included in the Fishbone Diagram solution from the Management area of ConceptDraw Solution Park.
Quality fishbone diagram
 Fishbone Diagrams
The Fishbone Diagrams solution extends ConceptDraw PRO v10 software with the ability to easily draw the Fishbone Diagrams (Ishikawa Diagrams) to clearly see the cause and effect analysis and also problem solving. The vector graphic diagrams produced using this solution can be used in whitepapers, presentations, datasheets, posters, and published technical material.
"Causes in the diagram are often categorized, such as to ...
The 5 Ss (used in service industry):
(1) Samples;
(2) Scheme;
(3) Synchronous;
(4) Skin;
(5) Search." [Ishikawa diagram. Wikipedia]
This service 4 Ss Ishikawa diagram (cause and effect diagram) template is included in the Fishbone Diagram solution from the Management area of ConceptDraw Solution Park.
4Ss fishbone diagram

- Cause and Effect Analysis ( Fishbone Diagrams ) | PROBLEM ...
- Fishbone Diagram | Business Productivity Diagramming ...
- Fishbone Diagram | Cause and Effect Analysis ( Fishbone Diagrams ...
- Fishbone Diagrams
- Using Fishbone Diagrams for Problem Solving | Business ...
- Cause and Effect Analysis ( Fishbone Diagrams ) | Using Fishbone ...
- Fishbone Diagram | Service 8 Ps fishbone diagram template ...
- Fishbone Diagram | Business Productivity Diagramming | How to ...
- Business Productivity Diagramming | Fishbone Diagram | Cause ...
- Fishbone Diagram | Business Productivity Diagramming | Cause ...
- Cause and Effect Analysis ( Fishbone Diagrams ) | Business ...
- Cause and Effect Analysis ( Fishbone Diagrams )
- Fishbone Diagram | Value Stream Mapping | Business Productivity ...
- Cause and Effect Analysis ( Fishbone Diagrams ) | Fishbone Diagram ...
- Fishbone Diagram | Types of Flowchart - Overview | Process ...
- Business Productivity Diagramming | Fishbone Diagram | Business ...
- Fishbone Diagram | Quality fishbone diagram template | Fishbone ...
- Fishbone Diagram | Business Productivity Diagramming | Use a ...
- Fishbone diagram template | Ishikawa diagram - Factors reducing ...
- Cause and Effect Analysis ( Fishbone Diagrams ) | Cause & Effect ...
- ERD | Entity Relationship Diagrams, ERD Software for Mac and Win
- Flowchart | Basic Flowchart Symbols and Meaning
- Flowchart | Flowchart Design - Symbols, Shapes, Stencils and Icons
- Flowchart | Flow Chart Symbols
- Electrical | Electrical Drawing - Wiring and Circuits Schematics
- Flowchart | Common Flowchart Symbols
- Flowchart | Common Flowchart Symbols