HelpDesk
How to Draw a Fishbone Diagram with ConceptDraw PRO
Fishbone (Ishikawa) Diagram is often used in business to determine the cause of some problem. A Fishbone diagram is also called cause-and-effect diagram.The main goal of the Fishbone diagram is to illustrate in a graphical way the relationship between a given outcome and all the factors that influence this outcome. The complete diagram resembles a fish skeleton as its name implies. Cause and Effect analysis is used in management to identify the possible causes of a problem in order to eliminate them. The ability to create a Fishbone Diagram is supported by the Fishbone Diagram solution.Process Flowchart
ConceptDraw is Professional business process mapping software for making process flow diagram, workflow diagram, general flowcharts and technical illustrations for business documents. It is includes rich examples, templates, process flowchart symbols. ConceptDraw flowchart maker allows you to easier create a process flowchart. Use a variety of drawing tools, smart connectors, flowchart symbols and shape libraries to create flowcharts of complex processes, process flow diagrams, procedures and information exchange.
HelpDesk
How to Create a SWOT Matrix Quickly
ConceptDraw PRO allow create SWOT Matrix in just one click for presenting analysis results preformed in mimd map structure using ConceptDraw MINDMAP.Personal area (PAN) networks. Computer and Network Examples
A Personal area network (PAN) is a computer network that is used for data transmission between different personal devices (computers, telephones, digital devices, etc.) and for connecting to the higher level network and Internet. PANs can be wired with computer buses (USB and FireWire). A wireless personal area network (WPAN) can be made using the network technologies such as Bluetooth, IrDa, UWB, Z-Wave, ZigBee, Body Area Network. A personal area network handles the interconnection of IT devices at the surrounding of a single user. Generally, PAN contains from following such appliances: cordless mice and keyboards, cordless phone, Bluetooth handsets.This example was created in ConceptDraw PRO using the Computer and Networks Area of ConceptDraw Solution Park and shows the Personal area network.

HelpDesk
How to Create a Fishbone (Ishikawa) Diagram Quickly
A Fishbone (Ishikawa) diagram is also called cause-and-effect diagram. Fishbone diagram is often used in business to determine the cause of some problem. The diagram illustrates the main causes and sub-causes leading to an event. The main goal of the Fishbone diagram is to illustrate in a graphical way the relationship between a given outcome and all the factors that influence this outcome. The complete diagram resembles a fish skeleton as its name implies. The ability to create a Fishbone Diagram is supported by the Fishbone Diagram solution. Use ConceptDraw MINDMAP for structuring data and then ConceptDraw PRO for generating a Fishbone Diagram from mind map structure.SWOT Analysis
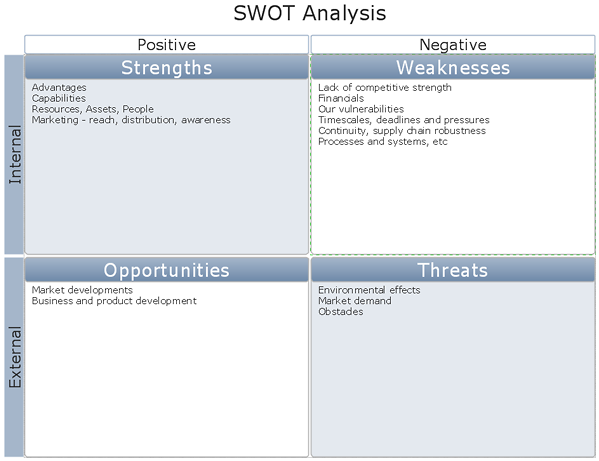
The SWOT Analysis provides information that is helpful in matching the firm's resources and capabilities to the competitive environment in which it operates. As such, it is instrument in strategy formulation and selection. SWOT analysis is a method of strategic planning which identifies the factors internal and external environment of the firm and divides them into 4 categories: strengths, weaknesses, opportunities and threats. The ConceptDraw PRO and MINDMAP software allow professional to make well-designed SWOT matrix in minutes.
 Rapid UML
Rapid UML solution extends ConceptDraw PRO software with templates, samples and libraries of vector stencils for quick drawing the UML diagrams using Rapid Draw technology.
- Fishbone Diagram Problem Solving | Using Fishbone Diagrams for ...
- Fishbone Analysis Examples Service Desk
- Fishbone Diagram Example For Service Industry
- Example Service Desk Update Templates
- Example of Organizational Chart | Fishbone Diagram | School and ...
- Fishbone Diagram Help Desk
- Cause and Effect Analysis - Fishbone Diagrams for Problem Solving ...
- Analysis Diagram Examples
- Service 8 Ps fishbone diagram - Template | Fishbone Diagram ...
- Service Desk Dashboard Examples
- UML Deployment Diagram Example - ATM System UML diagrams ...
- Fishbone Diagram For Customer Service
- Fishbone Diagram Problem Solving | Using Fishbone Diagrams for ...
- UML sequence diagram - Help desk | BPR Diagram . Business ...
- Service Desk Local Flow
- Contoh Flowchart | Flow chart Example . Warehouse Flowchart ...
- Fishbone diagram - Production process
- Fishbone Analysis Example Pdf
- Fishbone Diagram | Service 4 Ss fishbone diagram - Template ...
- Fault Tree Analysis Diagrams | Root cause analysis tree diagram ...
- ERD | Entity Relationship Diagrams, ERD Software for Mac and Win
- Flowchart | Basic Flowchart Symbols and Meaning
- Flowchart | Flowchart Design - Symbols, Shapes, Stencils and Icons
- Flowchart | Flow Chart Symbols
- Electrical | Electrical Drawing - Wiring and Circuits Schematics
- Flowchart | Common Flowchart Symbols
- Flowchart | Common Flowchart Symbols


