 Fishbone Diagram
Fishbone Diagrams solution extends ConceptDraw PRO software with templates, samples and library of vector stencils for drawing the Ishikawa diagrams for cause and effect analysis.
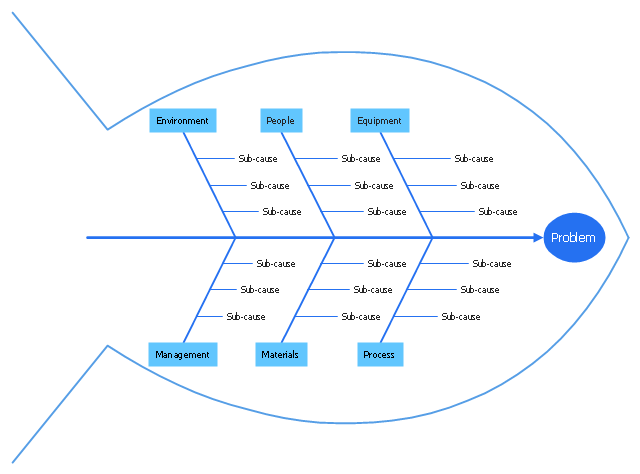
"Common uses of the Ishikawa diagram are product design and quality defect prevention, to identify potential factors causing an overall effect. Each cause or reason for imperfection is a source of variation. Causes are usually grouped into major categories to identify these sources of variation. The categories typically include:
(1) People: Anyone involved with the process;
(2) Methods: How the process is performed and the specific requirements for doing it, such as policies, procedures, rules, regulations and laws;
(3) Machines: Any equipment, computers, tools, etc. required to accomplish the job;
(4) Materials: Raw materials, parts, pens, paper, etc. used to produce the final product;
(5) Measurements: Data generated from the process that are used to evaluate its quality;
(6) Environment: The conditions, such as location, time, temperature, and culture in which the process operates. ...
Ishikawa diagrams were popularized by Kaoru Ishikawa in the 1960s, who pioneered quality management processes in the Kawasaki shipyards, and in the process became one of the founding fathers of modern management.
The basic concept was first used in the 1920s, and is considered one of the seven basic tools of quality control." [Ishikawa diagram. Wikipedia]
This quality Ishikawa diagram (cause and effect diagram) template is included in the Fishbone Diagram solution from the Management area of ConceptDraw Solution Park.
Quality fishbone diagram
"Ishikawa diagrams (also called fishbone diagrams, herringbone diagrams, cause-and-effect diagrams, or Fishikawa) are causal diagrams created by Kaoru Ishikawa (1968) that show the causes of a specific event. Common uses of the Ishikawa diagram are product design and quality defect prevention, to identify potential factors causing an overall effect. Each cause or reason for imperfection is a source of variation. Causes are usually grouped into major categories to identify these sources of variation. The categories typically include:
- People: Anyone involved with the process
- Methods: How the process is performed and the specific requirements for doing it, such as policies, procedures, rules, regulations and laws
- Machines: Any equipment, computers, tools, etc. required to accomplish the job
- Materials: Raw materials, parts, pens, paper, etc. used to produce the final product
- Measurements: Data generated from the process that are used to evaluate its quality
- Environment: The conditions, such as location, time, temperature, and culture in which the process operates" [Ishikawa diagram. Wikipedia]
The fishbone diagram example "Causes of low-quality output" was created using the ConceptDraw PRO diagramming and vector drawing software extended with the Fishbone Diagrams solution from the Management area of ConceptDraw Solution Park.
Ishikawa diagram

Fishbone Diagram Example

Fishbone Diagrams solution included to ConceptDraw Solution Park contains powerful drawing tools and a lot of examples, samples and templates. Each Fishbone diagram example is carefully thought-out by experts and is perfect source of inspiration for you.
Use a Fishbone Diagram to Attack Complex Problems

Use ConceptDraw PRO diagramming software with Fishbone Diagrams Solution to attack any complex problems with fishbone diagrams graphic method. Construct Fishbone diagram to help users brainstorm and break down a complex problem.
Improving Problem Solving and Focus with Fishbone Diagrams

ConceptDraw PRO extended with Fishbone Diagrams solution gives a powerful tool for improving problem solving and focus with Fishbone diagrams.
Create Fishbone Diagrams with the ConceptDraw

The library of vector stencils "Fishbone diagrams" contains 13 symbols for drawing the Ishikawa diagrams using the ConceptDraw PRO diagramming and vector drawing software.
"Ishikawa diagrams were popularized by Kaoru Ishikawa in the 1960s, who pioneered quality management processes in the Kawasaki shipyards, and in the process became one of the founding fathers of modern management.
The basic concept was first used in the 1920s, and is considered one of the seven basic tools of quality control. It is known as a fishbone diagram because of its shape, similar to the side view of a fish skeleton." [Ishikawa diagram. Wikipedia]
"The Seven Basic Tools of Quality is a designation given to a fixed set of graphical techniques identified as being most helpful in troubleshooting issues related to quality. They are called basic because they are suitable for people with little formal training in statistics and because they can be used to solve the vast majority of quality-related issues.
The seven tools are:
(1) Cause-and-effect diagram (also known as the "fishbone" or Ishikawa diagram);
(2) Check sheet;
(3) Control chart;
(4) Histogram;
(5) Pareto chart;
(6) Scatter diagram;
(7) Stratification (alternately, flow chart or run chart)." [Seven Basic Tools of Quality. Wikipedia]
The example "Design elements - Fishbone diagram" is included in the Fishbone Diagrams solution from the Management area of ConceptDraw Solution Park.
Ishikawa diagram symbols

 Management
This solution extends ConceptDraw PRO v9 and ConceptDraw MINDMAP v7 with Management Diagrams and Mind Maps (decision making, scheduling, thinking ideas, problem solving, business planning, company organizing, SWOT analysis, preparing and holding meetings
Total Quality Management with ConceptDraw
 method - Fishbone diagram template")
Total Quality Management Value

Total Quality Management Business Diagram

TQM Diagram Tool

Cause and Effect Analysis

Cause and Effect Analysis - Fishbone Diagrams for Problem Solving

 PM Response
This solution extends all ConceptDraw Office 2.0 products by helping to improve the response time to project changes. PM Response also helps with iteration planning, discussing project layout approaches, and solving project challenges.
- Fishbone Diagram | Business Productivity Diagramming | Business ...
- Fishbone Diagram | Quality fishbone diagram template | Fishbone ...
- Value Stream Mapping | Quality | Fishbone Diagram |
- Seven Management and Planning Tools | Fishbone Diagram | Total ...
- Fishbone Diagram | Total Quality Management with ConceptDraw ...
- Fishbone diagram - Production process | Fishbone Diagram ...
- Business Productivity Diagramming | Fishbone Diagram ...
- Business Productivity Diagramming | Fishbone Diagram | Cause ...
- Fishbone Diagram | Value Stream Mapping | Business Productivity ...
- Total Quality Management TQM Diagrams | TQM Software Build ...
- Business Productivity Diagramming | Total Quality Management with ...
- Fishbone Diagram | Business Productivity Diagramming | Business ...
- Total Quality Management TQM Diagrams - Conceptdraw.com
- Business Productivity Diagramming | Fishbone Diagram | Total ...
- Fishbone diagram - Causes of low- quality output | Total Quality ...
- Fishbone Diagram | Management | Total Quality Management with ...
- Business Productivity Area | Total Quality Management Business ...
- Total Quality Management Value | Fishbone Diagram | Types of ...
- Fishbone Diagram | Total Quality Management Value | Project ...
- Business Productivity Diagramming | Using Fishbone Diagrams for ...
- ERD | Entity Relationship Diagrams, ERD Software for Mac and Win
- Flowchart | Basic Flowchart Symbols and Meaning
- Flowchart | Flowchart Design - Symbols, Shapes, Stencils and Icons
- Flowchart | Flow Chart Symbols
- Electrical | Electrical Drawing - Wiring and Circuits Schematics
- Flowchart | Common Flowchart Symbols
- Flowchart | Common Flowchart Symbols