"Causes in the diagram are often categorized, such as to ...
The 7 Ps (used in marketing industry):
(1) Product/ Service;
(2) Price;
(3) Place;
(4) Promotion;
(5) People/ personnel;
(6) Positioning;
(7) Packaging. " [Ishikawa diagram. Wikipedia]
This 8 Ps Ishikawa diagram (service cause and effect diagram) template is included in the Fishbone Diagram solution from the Management area of ConceptDraw Solution Park.
8Ps fishbone diagram

 Fishbone Diagrams
The Fishbone Diagrams solution extends ConceptDraw DIAGRAM software with the ability to easily draw the Fishbone Diagrams (Ishikawa Diagrams) to clearly see the cause and effect analysis and also problem solving. The vector graphic diagrams produced using this solution can be used in whitepapers, presentations, datasheets, posters, and published technical material.
Fishbone Diagram Procedure

Draw Fishbone Diagram on MAC Software

Professional diagramming ConceptDraw DIAGRAM MAC OSX software with Fishbone Diagrams solution helps you make cause and effect analysis, identify the possible causes for an effect for problem solving, draw Fishbone diagram on Mac software aka Ishikawa diagram from brainstorm, templates and examples.
Total Quality Management Business Diagram

Competitor Analysis

Fishbone Diagram Template

ConceptDraw DIAGRAM diagramming and vector drawing software enhanced with Fishbone Diagrams solution helps you create business productivity diagrams from Fishbone diagram templates and examples, that provide to start using of the graphic method for the analysis of problem causes. Each predesigned Fishbone Diagram template is ready to use and useful for instantly drawing your own Fishbone Diagram.
Create Fishbone Diagrams with the ConceptDraw

Wireframing
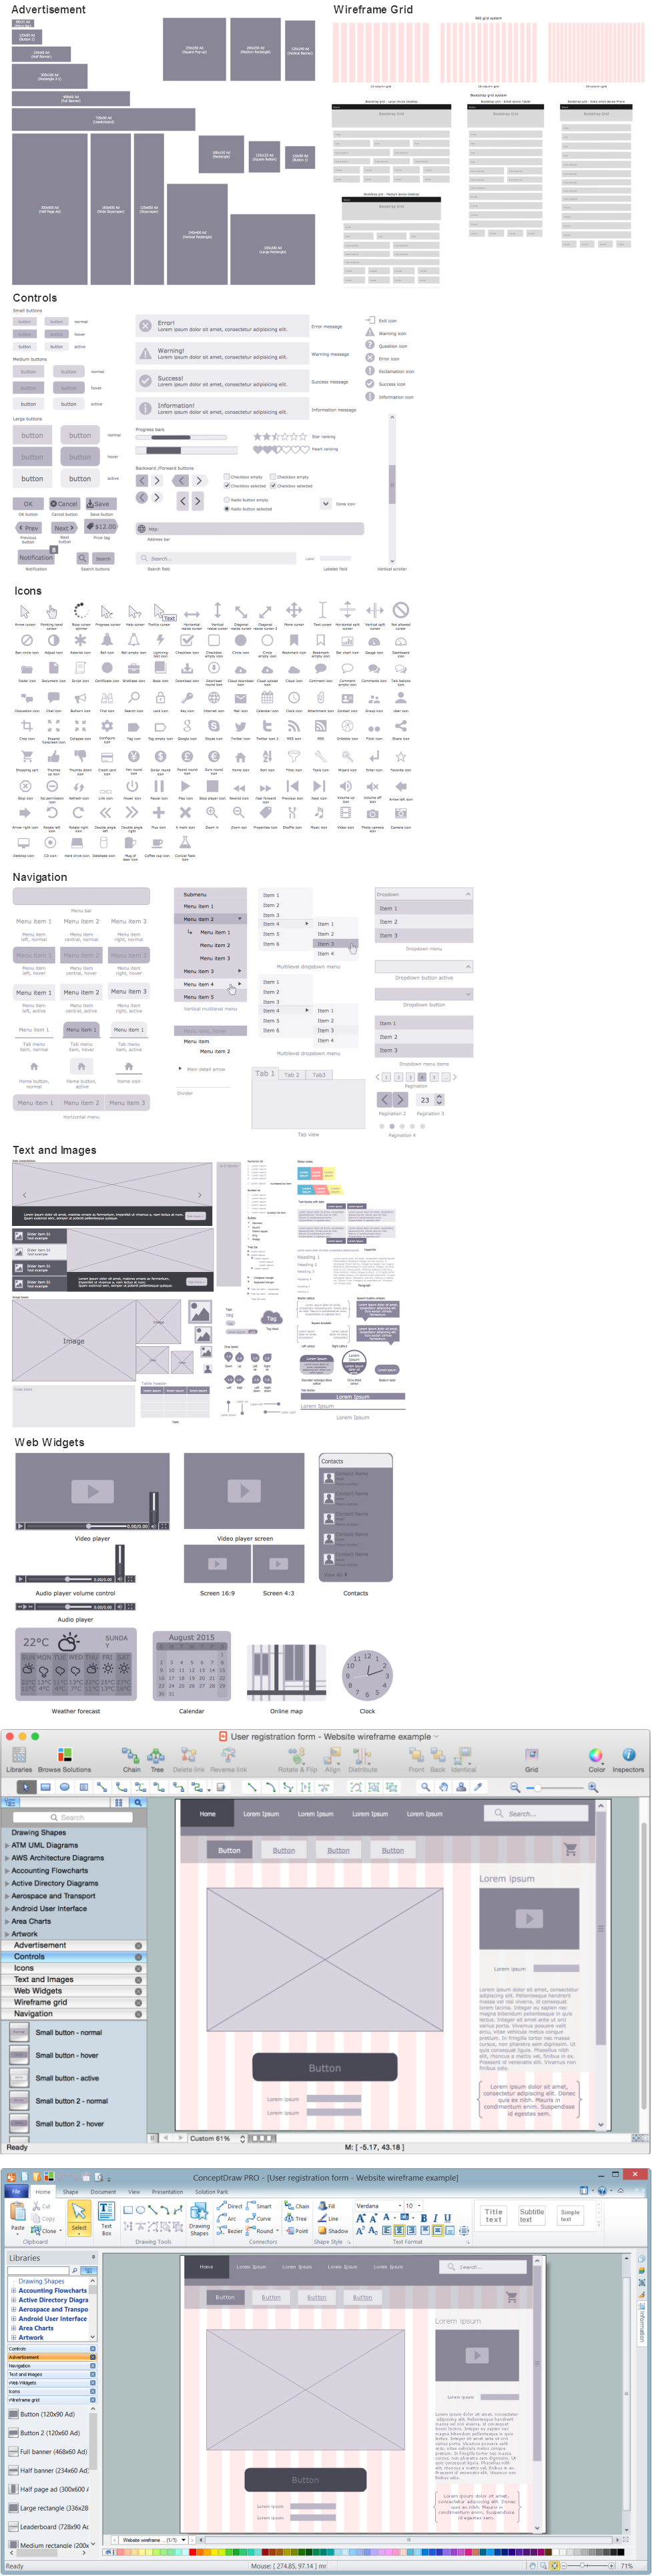
ConceptDraw DIAGRAM extended with Website Wireframe solution from the Software Development area is the best wireframing software. Using the wireframe tools, libraries of vector objects, template and examples which offers a Website Wireframe solution, you will easily design the websites wireframes of any complexity.
Flowchart Software

ConceptDraw DIAGRAM flowchart software will help to quickly create new flowcharts, workflow, NS Diagram, BPMN Diagram, Cross-functional flowcharts, data flow diagrams and highlight flowcharts.
Feature-rich flowchart maker, free thousand flowchart examples and templates and colored symbols that will allow you to create professional looking flowcharts simply.
ConceptDraw DIAGRAM supports macOS and Windows.

- Fishbone Diagram | Fishbone Diagrams | Service 8 Ps fishbone ...
- Service 8 Ps fishbone diagram - Template | Fishbone Diagram ...
- Fishbone Diagram | Fishbone Diagrams | Service 8 Ps fishbone ...
- Fishbone Diagrams | Service 4 Ss fishbone diagram - Template ...
- Service 8 Ps fishbone diagram - Template | Fishbone Diagrams ...
- Fishbone Diagrams | Draw Fishbone Diagram on MAC Software ...
- Venn diagram - Relationship marketing | Cause and Effect Fishbone ...
- Fishbone Diagram | Fishbone Diagrams | Service 8 Ps fishbone ...
- Fishbone Diagrams | Stakeholder Onion Diagrams | Block diagram ...
- Fishbone Diagrams | Fishbone Diagram | Service 8 Ps fishbone ...
- ERD | Entity Relationship Diagrams, ERD Software for Mac and Win
- Flowchart | Basic Flowchart Symbols and Meaning
- Flowchart | Flowchart Design - Symbols, Shapes, Stencils and Icons
- Flowchart | Flow Chart Symbols
- Electrical | Electrical Drawing - Wiring and Circuits Schematics
- Flowchart | Common Flowchart Symbols
- Flowchart | Common Flowchart Symbols