Bar Diagrams for Problem Solving. Create economics and financial bar charts with Bar Graphs Solution

Financial Comparison Chart

Sales Growth. Bar Graphs Example

Rainfall Bar Chart

This sample was created in ConceptDraw PRO diagramming and vector drawing software using the Bar Graphs Solution from the Graphs and Charts area of ConceptDraw Solution Park.
Bar Chart

Process Flowchart


Pie Chart Word Template. Pie Chart Examples

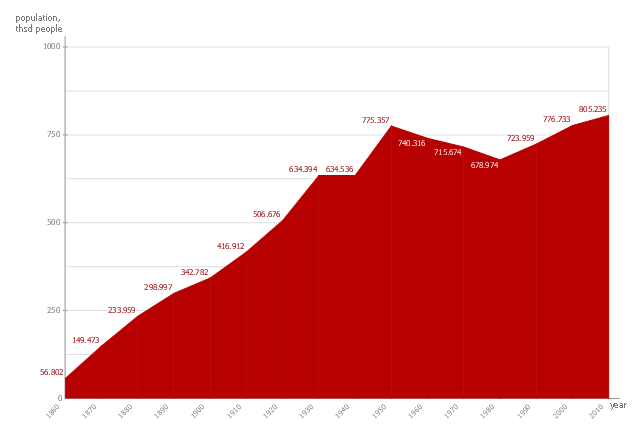
This area chart sample shows the San Francisco population changes from 1860 to 2010.
"San Francisco ..., officially the City and County of San Francisco, is the leading financial and cultural center of Northern California and the San Francisco Bay Area.
The only consolidated city-county in California, San Francisco encompasses a land area of about 46.9 square miles (121 km2) on the northern end of the San Francisco Peninsula, giving it a density of about 17,620 people per square mile (6,803 people per km2). It is the most densely settled large city (population greater than 200,000) in the state of California and the second-most densely populated major city in the United States after New York City. San Francisco is the fourth most populous city in California, after Los Angeles, San Diego and San Jose, and the 14th most populous city in the United States—with a Census-estimated 2012 population of 825,863. The city is also the financial and cultural hub of the larger San Jose-San Francisco-Oakland metropolitan area, with a population of 8.4 million." [San Francisco. Wikipedia]
The area graph example "San Francisco population history" was created using the ConceptDraw PRO diagramming and vector drawing software extended with the Area Charts solution from the Graphs and Charts area of ConceptDraw Solution Park.
Area chart
Feature Comparison Chart Software

This sample shows the Feature Comparison Chart of the digital scouting cameras. It can be useful for digital cameras production field, marketing, sales, etc.
 Bar Graphs
The Bar Graphs solution enhances ConceptDraw PRO v10 functionality with templates, numerous professional-looking samples, and a library of vector stencils for drawing different types of Bar Graphs, such as Simple Bar Graph, Double Bar Graph, Divided Bar Graph, Horizontal Bar Graph, Vertical Bar Graph, and Column Bar Chart.
Relative Value Chart Software

Relative values are widely used in:business, economics, investment, management, marketing, statistics, etc.
ConceptDraw PRO software is the best for drawing professional looking Relative Value Charts. ConceptDraw PRO provides Divided Bar Diagrams solution from the Graphs and Charts Area of ConceptDraw Solution Park.
Bar Graph

Purchasing Flow Chart. Purchasing Flowchart Example

Pie Donut Chart. Pie Chart Examples

The Pie Donut Chart visualizes the percentage of parts of the whole and looks like as a ring divided into sectors. Pie Donut Charts are widely used in the business, statistics, analytics, mass media.
Contoh Flowchart

The Contoh Flowchart included to Flowcharts solution are professional looking practical samples and you can quick and easy modify them, print, or publish on web.
- Financial Comparison Chart | Sales Growth. Bar Graphs Example ...
- Financial Comparison Chart | Bar Diagrams for Problem Solving ...
- Sales Growth. Bar Graphs Example | Bar Chart Examples | Bar ...
- Financial Comparison Chart | Rainfall Bar Chart | Process Flowchart ...
- Financial Comparison Chart | Bar Graph | Bar Chart Template for ...
- Rainfall Bar Chart | Financial Comparison Chart | Sales Growth. Bar ...
- Financial Comparison Chart | Rainfall Bar Chart | Bar Graph | How ...
- Percentage Pie Chart . Pie Chart Examples | Chart Maker for ...
- Financial Comparison Chart | Percentage Pie Chart . Pie Chart ...
- Sales Growth. Bar Graphs Example | Financial Comparison Chart ...
- Bar Diagrams for Problem Solving. Create economics and financial ...
- Diagram And Graph Of Financial Institutions Investment
- Waterfall Bar Chart | Export from ConceptDraw MINDMAP to ...
- Financial Comparison Chart | Bar Graph Ratio In Accounts
- Financial Comparison Chart | Rainfall Bar Chart | Purchasing Flow ...
- Bar Chart Examples | Bar Diagrams for Problem Solving. Create ...
- Feature Comparison Chart Software | Bar Chart Template for Word ...
- Financial Comparison Chart | Feature Comparison Chart Software ...
- Financial Comparison Chart | Rainfall Bar Chart | Bar Chart | Ratio ...
- Rainfall Bar Chart | Bar Chart Examples | Financial Comparison ...
- ERD | Entity Relationship Diagrams, ERD Software for Mac and Win
- Flowchart | Basic Flowchart Symbols and Meaning
- Flowchart | Flowchart Design - Symbols, Shapes, Stencils and Icons
- Flowchart | Flow Chart Symbols
- Electrical | Electrical Drawing - Wiring and Circuits Schematics
- Flowchart | Common Flowchart Symbols
- Flowchart | Common Flowchart Symbols