 Flowcharts
The Flowcharts Solution for ConceptDraw PRO v10 is a comprehensive set of examples and samples in several different color themes for professionals that need to graphically represent a process. Solution value is added by basic flow chart template and shapes' library of Flowchart notation. ConceptDraw PRO flow chart creator lets one depict a processes of any complexity and length, as well design of the flowchart either vertically or horizontally.
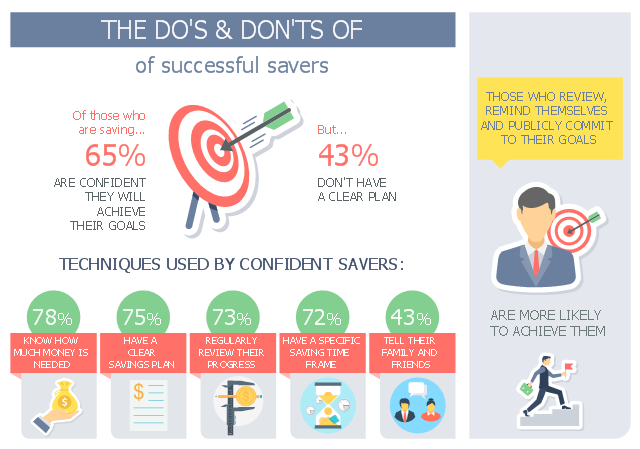
This business infographic sample shows how Australians save money, people's different saving styles as well as the techniques used by successful savers. It was designed on the base of the infographic "How Australians save money" from the MoneySmart website of the Australian Securities and Investments Commission (ASIC).
[moneysmart.gov.au/ managing-your-money/ saving/ how-australians-save-money]
"Saving is income not spent, or deferred consumption. Methods of saving include putting money aside in, for example, a deposit account, a pension account, an investment fund, or as cash. Saving also involves reducing expenditures, such as recurring costs. In terms of personal finance, saving generally specifies low-risk preservation of money, as in a deposit account, versus investment, wherein risk is higher; in economics more broadly, it refers to any income not used for immediate consumption." [Saving. Wikipedia]
The business infographic example "Do's and Don'ts of successful savers" was designed using ConceptDraw PRO diagramming and vector drawing software extended with the Business and Finance solution from Illustration area of ConceptDraw Solution Park.
Infographic
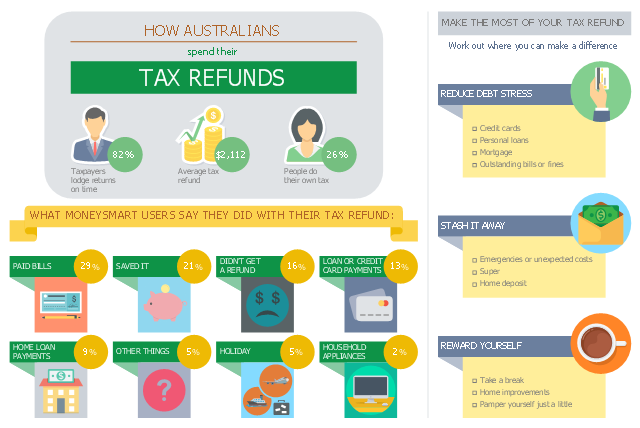
This business infographic sample shows the average tax refund and how people say they spent last year's tax refund. It was designed on the base of the infographic "How Australians spend their tax refunds" from the MoneySmart website of the Australian Securities and Investments Commission (ASIC).
[moneysmart.gov.au/ managing-your-money/ income-tax/ how-australians-spend-their-tax-refunds]
"A tax refund or tax rebate is a refund on taxes when the tax liability is less than the taxes paid. Taxpayers can often get a tax refund on their income tax if the tax they owe is less than the sum of the total amount of the withholding taxes and estimated taxes that they paid, plus the refundable tax credits that they claim. (Tax refunds are money given back at the end of the financial year.)" [Tax refund. Wikipedia]
The business infographic example "How Australians spend their tax refunds" was designed using ConceptDraw PRO diagramming and vector drawing software extended with the Business and Finance solution from Illustration area of ConceptDraw Solution Park.
Infographic
- Financial Trade UML Use Case Diagram Example | UML Business ...
- Bar Diagrams for Problem Solving. Create economics and financial ...
- Business and Finance Illustrations Example | How to Create an ...
- UML Use Case Diagram Example - Estate Agency | Financial Trade ...
- Invoice payment process - Flowchart | Accounting Flowchart ...
- Ecosystem goods and services - Segmented pyramid diagram ...
- Sales Process Flowchart. Flowchart Examples | Sales Process ...
- UML Component Diagram Example - Online Shopping | UML Use ...
- UML deployment diagram - Real estate transactions | Databases ...
- Purchasing Flowchart - Purchase Order. Flowchart Examples | Steps ...
- Accounting Flowchart Purchasing Receiving Payable and Payment ...
- Sales Process Flowchart. Flowchart Examples | Basic Flowchart ...
- Pyramid Diagram | UML Activity Diagram | Map of median ...
- Bank Detailed Answers | UML activity diagram - Cash withdrawal ...
- Divided Bar Diagrams
- Managing the task list | Global Payment Solutions | UML activity ...
- How to Draw an Organization Chart | Organizational Structure ...
- UML Deployment Diagram | Diagramming Software for Design UML ...
- Account Flowchart Stockbridge System. Flowchart Examples | Flow ...
- Business process Flow Chart - Event-Driven Process chain (EPC ...
- ERD | Entity Relationship Diagrams, ERD Software for Mac and Win
- Flowchart | Basic Flowchart Symbols and Meaning
- Flowchart | Flowchart Design - Symbols, Shapes, Stencils and Icons
- Flowchart | Flow Chart Symbols
- Electrical | Electrical Drawing - Wiring and Circuits Schematics
- Flowchart | Common Flowchart Symbols
- Flowchart | Common Flowchart Symbols