Basic Flowchart Symbols and Meaning


Copying Service Process Flowchart. Flowchart Examples

This sample shows the Flowchart on that it is displayed the process of the determination the permissibility according the Access Copyright license. The diamonds represent the decision points. Inside the diamonds are the questions that need the answer yes/no. It is necessary to answer on the question, make the decision that will determine the next step.
Flowchart of Products. Flowchart Examples

A Flowchart is a graphically representation of the process that step-by-step lead to the solution the problem. The geometric figures on the Flowchart represent the steps of the process and are connected with arrows that show the sequence of the actions. The Flowcharts are widely used in engineering, architecture, science, analytics, government, politics, business, marketing, manufacturing, administration, etc.
Technical Flow Chart Example

ConceptDraw PRO enhanced with Flowcharts Solution from the "Diagrams" Area of ConceptDraw Solution is a perfect software for drawing Technical Flow Chart Example illustrating the essence and importance of the technical flow chart use.
Example Process Flow

ConceptDraw PRO is a Process Flowcharts software. This software includes basic package of process flow examples. The software contains object libraries with vector stencils that allows you use RapidDraw technology. By clicking on direction arrows you can add a new object to the flowchart.
Business People Figures

Just check ConceptDraw business perople figusers pictures, you will see all kinds of silhouetes: Staff, Employed workers, Persons and Groups symbols.
Best popular vector pictures are: men, dancing people, business man.
Use human contours wise and it will help you to tell main idea of your design message.
Types of Welding in Flowchart

This sample shows the Flowchart that displays the solid-state welding processes, the types of welding.
Double-headed Cross Functional Flowchart

Sample Project Flowchart. Flowchart Examples

This sample was created in ConceptDraw PRO diagramming and vector drawing software using the Flowcharts solution from the Diagrams area of ConceptDraw Solution Park.

Scientific Symbols Chart

Mathematics Solution from the Science and Education area of ConceptDraw Solution Park includes a few shape libraries of plane, solid geometric figures, trigonometrical functions and greek letters to help you create different professional looking mathematic illustrations for science and education.
Constellation Chart

Astronomy solution contains 4 libraries with vector objects of all variety of constellations: Constellations Except Zodiac Northern and Southern, Northern Constellations, Southern Constellations and Zodiac Constellations.
Horizontal Flowchart

A Flowchart is a graphically representation of the process, algorithm or the step-by-step solution of the problem. The Flowcharts have one or more starting and ending points. The geometric figures on the Flowcharts represent the steps of the process and are connected with arrows that show the sequence of the actions.
Basic Flowchart Images. Flowchart Examples

This sample shows the Flowchart that displays the procedures of 2PP (two-party preferred) voting and counting the voters. The two-party-preferred vote is the result of the elections that was distributed to the final two parties.
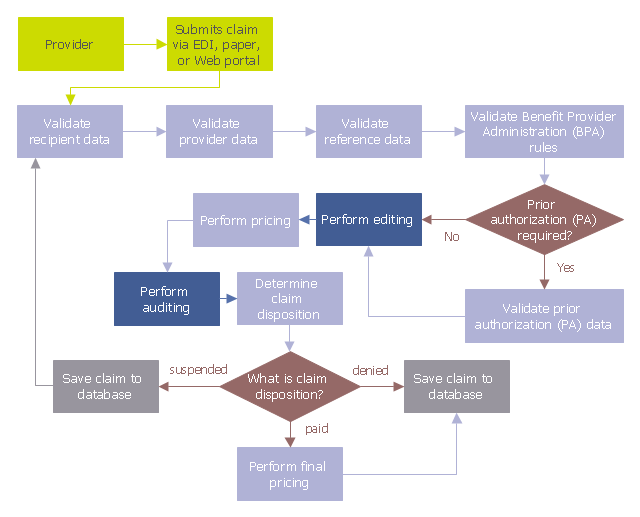
This audit flowchart sample was created on the base of the figure illustrating the webpage "Introduction to Claims Edits, Audits, Error Status Codes, and EOBs" from the website of the Ohio Department of Medicaid.
"Process.
As claims are submitted and processed, the data on the claim is validated against a series of rules, edits, and audits. Review the flowchart below to follow the sequence in which claim data is processed to see where edits and audits impact the claim adjudication process." [medicaid.ohio.gov/ PROVIDERS/ MITS/ MITSNonProviderCommunications/ MITSOnlineTutorials/ IntroductiontoClaimsEdits,Audits.aspx]
The audit flowchart example "Claim data processing" was created using the ConceptDraw PRO diagramming and vector drawing software extended with the Audit Flowcharts solution from the Finance and Accounting area of ConceptDraw Solution Park.
www.conceptdraw.com/ solution-park/ finance-audit-flowcharts
Audit flowchart
- Mathematics Symbols | Mathematical Diagrams | Basic Flowchart ...
- Mathematics Symbols | Horizontal Flowchart | Mechanical Drawing ...
- Mathematical Diagrams | Basic Flowchart Symbols and Meaning ...
- Mathematics | Mathematical Diagrams | Basic Flowchart Symbols ...
- Mathematical Diagrams | Mathematics Symbols | Basic Flowchart ...
- Process Flowchart | Business People Figures | Audit Flowchart ...
- Basic Flowchart Symbols and Meaning | Business People Figures ...
- Make A Diagram Or Model Using Geometric Figures
- Basic Flowchart Symbols and Meaning | Horizontal Flowchart ...
- Double-headed Cross Functional Flowchart | Business People ...
- Geometric Figures
- Flowchart And Figures Of Industrial Management
- Mathematics Symbols | Basic Flowchart Symbols and Meaning ...
- Process Flowchart | Material Requisition Flowchart . Flowchart ...
- Process Flowchart | How to Design an Interface Mock-up of an ...
- Geometrical Figures
- Basic Flowchart Symbols and Meaning | Mathematics Symbols ...
- Solid Figures Elements
- Windows 8 apps - Vector stencils library | Business People Figures ...
- Design elements - Solid geometry | Basic Flowchart Symbols and ...
- ERD | Entity Relationship Diagrams, ERD Software for Mac and Win
- Flowchart | Basic Flowchart Symbols and Meaning
- Flowchart | Flowchart Design - Symbols, Shapes, Stencils and Icons
- Flowchart | Flow Chart Symbols
- Electrical | Electrical Drawing - Wiring and Circuits Schematics
- Flowchart | Common Flowchart Symbols
- Flowchart | Common Flowchart Symbols