Feature Comparison Chart Software

This sample shows the Feature Comparison Chart of the digital scouting cameras. It can be useful for digital cameras production field, marketing, sales, etc.
Financial Comparison Chart

Bar Chart Template for Word

You can quickly rework these bar graph templates into your own charts by simply changing displayed data, title and legend texts.
How to Create Presentation of Your Project Gantt Chart

Workflow Diagram Symbols

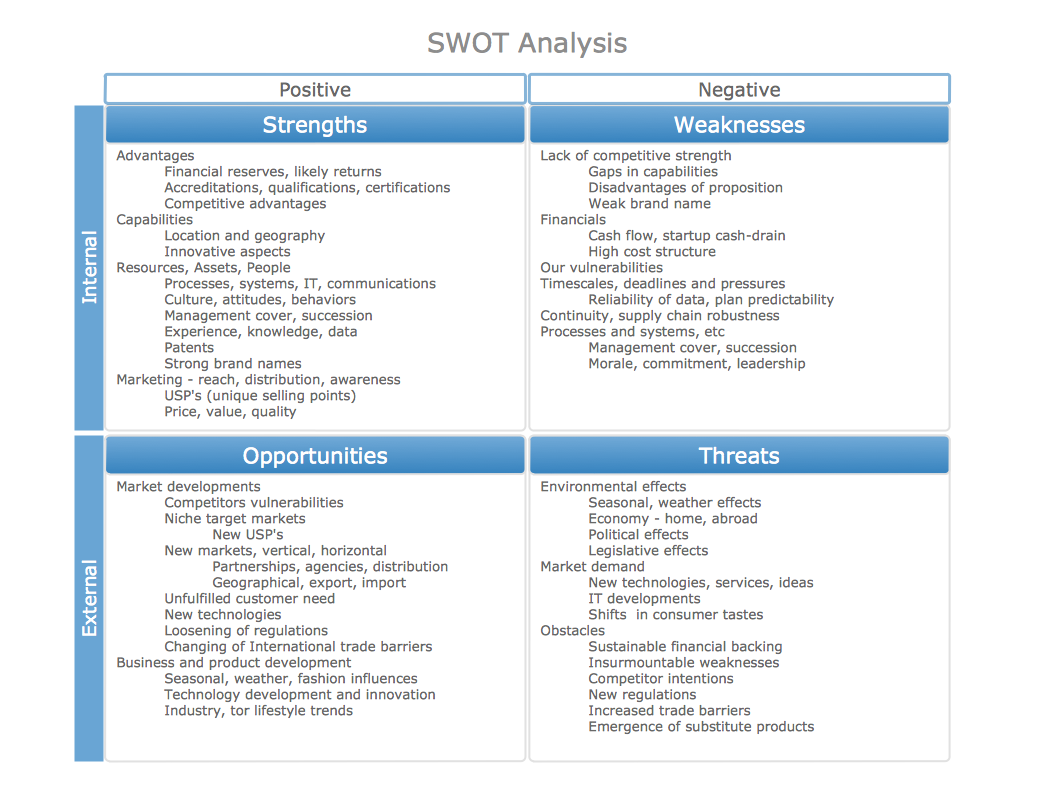
SWOT Analysis matrix templates and samples
Pie Chart Examples and Templates

Pie chart examples and templates created using ConceptDraw DIAGRAM software helps you get closer with pie charts and find pie chart examples suite your needs.
SWOT analysis Software & Template for Macintosh and Windows

SWOT matrix template

SWOT Analysis Solution - Strategy Tools

- Comparison Chart Template Excel
- Product Comparison Chart Excel Template
- Product Feature Comparison Template Excel
- Product Comparison Template Excel
- Product Comparison Template Excel Free
- Product Comparison Matrix Template
- Marketing | Product Comparison Matrix Template Excel
- Product Comparison Chart Template
- Marketing Matrix Template Excel
- Marketing | Feature Matrix Template
- ERD | Entity Relationship Diagrams, ERD Software for Mac and Win
- Flowchart | Basic Flowchart Symbols and Meaning
- Flowchart | Flowchart Design - Symbols, Shapes, Stencils and Icons
- Flowchart | Flow Chart Symbols
- Electrical | Electrical Drawing - Wiring and Circuits Schematics
- Flowchart | Common Flowchart Symbols
- Flowchart | Common Flowchart Symbols