The vector stencils library "Fault tree analysis diagrams" contains 12 symbols for drawing Fault Tree Analysis (FTA) diagrams.
"Fault tree analysis (FTA) is a top down, deductive failure analysis in which an undesired state of a system is analyzed using Boolean logic to combine a series of lower-level events. This analysis method is mainly used in the fields of safety engineering and reliability engineering to understand how systems can fail, to identify the best ways to reduce risk or to determine (or get a feeling for) event rates of a safety accident or a particular system level (functional) failure. FTA is used in the aerospace, nuclear power, chemical and process, pharmaceutical, petrochemical and other high-hazard industries; but is also used in fields as diverse as risk factor identification relating to social service system failure.
In aerospace, the more general term "system Failure Condition" is used for the "undesired state" / Top event of the fault tree. These conditions are classified by the severity of their effects. The most severe conditions require the most extensive fault tree analysis. These "system Failure Conditions" and their classification are often previously determined in the functional Hazard analysis." [Fault tree analysis. Wikipedia]
The shapes example "Fault tree analysis diagrams" was created using the ConceptDraw PRO diagramming and vector drawing software extended with the Fault Tree Analysis Diagrams solution from the Engineering area of ConceptDraw Solution Park.
FTA diagram symbols

"Failure analysis is the process of collecting and analyzing data to determine the cause of a failure. It is an important discipline in many branches of manufacturing industry, such as the electronics industry, where it is a vital tool used in the development of new products and for the improvement of existing products. There are many companies which provide services to find the cause of failure in products, devices and in post disaster situations. The failure analysis process relies on collecting failed components for subsequent examination of the cause or causes of failure using a wide array of methods, especially microscopy and spectroscopy. The NDT or nondestructive testing methods (such as Industrial computed tomography scanning) are valuable because the failed products are unaffected by analysis, so inspection always starts using these methods." [Failure analysis. Wikipedia]
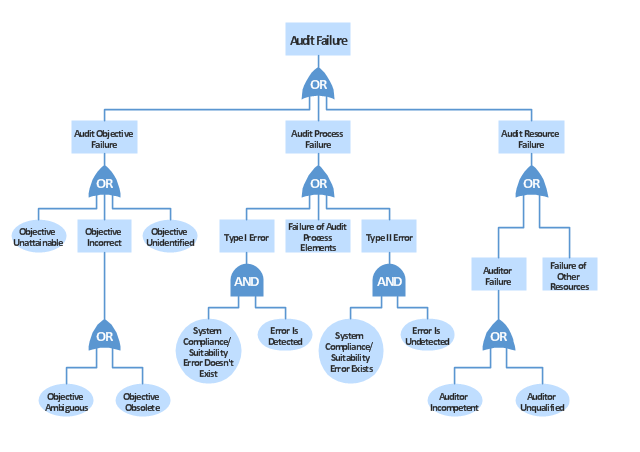
The example "Audit failure - Fault tree analysis diagram" was created using the ConceptDraw PRO diagramming and vector drawing software extended with the Fault Tree Analysis Diagrams solution from the Engineering area of ConceptDraw Solution Park.
The example "Audit failure - Fault tree analysis diagram" was created using the ConceptDraw PRO diagramming and vector drawing software extended with the Fault Tree Analysis Diagrams solution from the Engineering area of ConceptDraw Solution Park.
FTA diagram
Fault Tree Analysis Software

First of all, Fault Tree Analysis Diagrams Solution provides a set of samples which are the good examples of easy drawing professional looking Fault Tree Analysis Diagrams.
This example was redesigned from the Wikimedia Commons file: Example of High Level Fault Tree.jpg. [commons.wikimedia.org/ wiki/ File:Example_ of_ High_ Level_ Fault_ Tree.jpg]
"Risk assessment is the determination of quantitative or qualitative value of risk related to a concrete situation and a recognized threat (also called hazard). Quantitative risk assessment requires calculations of two components of risk (R):, the magnitude of the potential loss (L), and the probability (p) that the loss will occur. Acceptable risk is a risk that is understood and tolerated usually because the cost or difficulty of implementing an effective countermeasure for the associated vulnerability exceeds the expectation of loss.
In all types of engineering of complex systems sophisticated risk assessments are often made within Safety engineering and Reliability engineering when it concerns threats to life, environment or machine functioning. The nuclear, aerospace, oil, rail and military industries have a long history of dealing with risk assessment. Also, medical, hospital, social service and food industries control risks and perform risk assessments on a continual basis. Methods for assessment of risk may differ between industries and whether it pertains to general financial decisions or environmental, ecological, or public health risk assessment." [Risk assessment. Wikipedia]
The FTA diagram example "High level fault tree" was created using the ConceptDraw PRO diagramming and vector drawing software extended with the Fault Tree Analysis Diagrams solution from the Engineering area of ConceptDraw Solution Park.
FTA diagram

 Event-driven Process Chain Diagrams
Event-driven Process Chain (EPC) Diagram is a type of flowchart widely used for modeling in business engineering and reengineering, business process improvement, and analysis. EPC method was developed within the Architecture of Integrated Information Systems (ARIS) framework.
System Design

S Video Connection

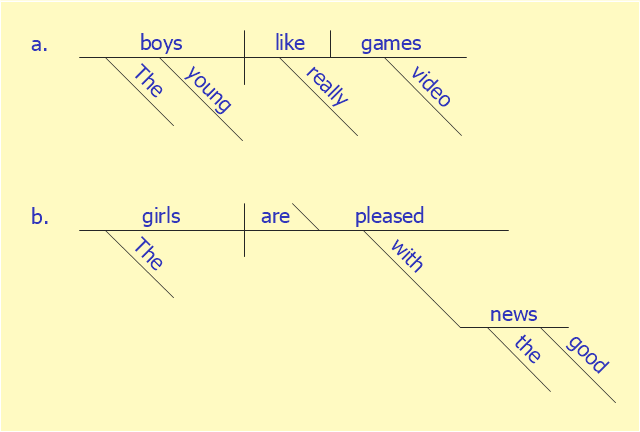
This sentence diagram example was redesigned from the Wikipedia file: Examples of Reed-Kellogg diagrams.jpg.
[en.wikipedia.org/ wiki/ File:Examples_ of_ Reed-Kellogg_ diagrams.jpg]
This file is licensed under the Creative Commons Attribution-Share Alike 3.0 Unported license. [creativecommons.org/ licenses/ by-sa/ 3.0/ deed.en]
"Most methods of diagramming in pedagogy are based on the work of Alonzo Reed and Brainerd Kellogg in their book Higher Lessons in English, first published in 1877, though the method has been updated with recent understanding of grammar. Reed and Kellogg were preceded, and their work probably informed, by W. S. Clark, who published his "balloon" method of depicting grammar in his 1847 book A Practical Grammar: In Which Words, Phrases & Sentences are Classified According to Their Offices and Their Various Relationships to Each Another.
Some schoolteachers continue to use the Reed-Kellogg system in teaching grammar, but others have discouraged it in favor of more modern tree diagrams. However, these modern tree structures draw on techniques that were already present in Reed-Kellogg diagrams. Reed and Kellogg defend their system in the preface to their grammar:
The Objections to the Diagram. - The fact that the pictorial diagram groups the parts of a sentence according to their offices and relations, and not in the order of speech, has been spoken of as a fault. It is, on the contrary, a merit, for it teaches the pupil to look through the literary order and discover the logical order. He thus learns what the literary order really is, and sees that this may be varied indefinitely, so long as the logical relations are kept clear.
The assertion that correct diagrams can be made mechanically is not borne out by the facts. It is easier to avoid precision in oral analysis than in written. The diagram drives the pupil to a most searching examination of the sentence, brings him face to face with every difficulty, and compels a decision on every point.
These statements bear witness to the fact that Reed-Kellogg diagrams abstract away from actual word order in order to focus more intently on how words in sentences function and relate to each other." [Sentence diagram. Wikipedia]
The examples of Reed-Kellogg diagrams was created using the ConceptDraw PRO diagramming and vector drawing software extended with the Language Learning solution from the Science and Education area of ConceptDraw Solution Park.
Sentence diagram
Process Engineering

Mechanical Engineering

SDL — Systems Engineering

 Winter Sports
The Winter Sports solution from Sport area of ConceptDraw Solution Park contains winter sports illustration examples, templates and vector clipart libraries.
Chemical Engineering

GHS Label Pictograms

Audio Connectors

- Accident analytic tree - FTA diagram | FTA diagram - Hazard ...
- Fault Tree Analysis Wiki
- Fault Tree Analysis Diagrams | PROBLEM ANALYSIS . Root Cause ...
- Fault Tree Analysis Diagrams | Design elements - Fault tree analysis ...
- Audit failure - Fault tree analysis diagram | Design elements - Fault ...
- Draw Fault Tree Analysis Online
- Fault Tree Analysis Software | Fault Tree Analysis Diagrams | Fault ...
- Root cause analysis tree diagram - Template | Fault Tree Analysis ...
- Problem Tree Analysis Wikipedia
- Fault Tree Analysis Software
- FTA diagram - Hazard analysis | Design elements - Fault tree ...
- Design elements - Fault tree analysis diagrams
- Design elements - Fault tree analysis diagrams | Fault Tree Analysis ...
- How to Create a Fault Tree Analysis Diagram (FTD) in ConceptDraw ...
- Fault Tree Analysis Software | Design elements - Fault tree analysis ...
- Fault Tree Analysis Software
- Safety Fault Tree Analysis Example
- Fault tree analysis - Insulin delivery system | High level fault tree ...
- Decision Tree Analysis Wiki
- Fault Tree Analysis Diagrams
- ERD | Entity Relationship Diagrams, ERD Software for Mac and Win
- Flowchart | Basic Flowchart Symbols and Meaning
- Flowchart | Flowchart Design - Symbols, Shapes, Stencils and Icons
- Flowchart | Flow Chart Symbols
- Electrical | Electrical Drawing - Wiring and Circuits Schematics
- Flowchart | Common Flowchart Symbols
- Flowchart | Common Flowchart Symbols