 Fault Tree Analysis Diagrams
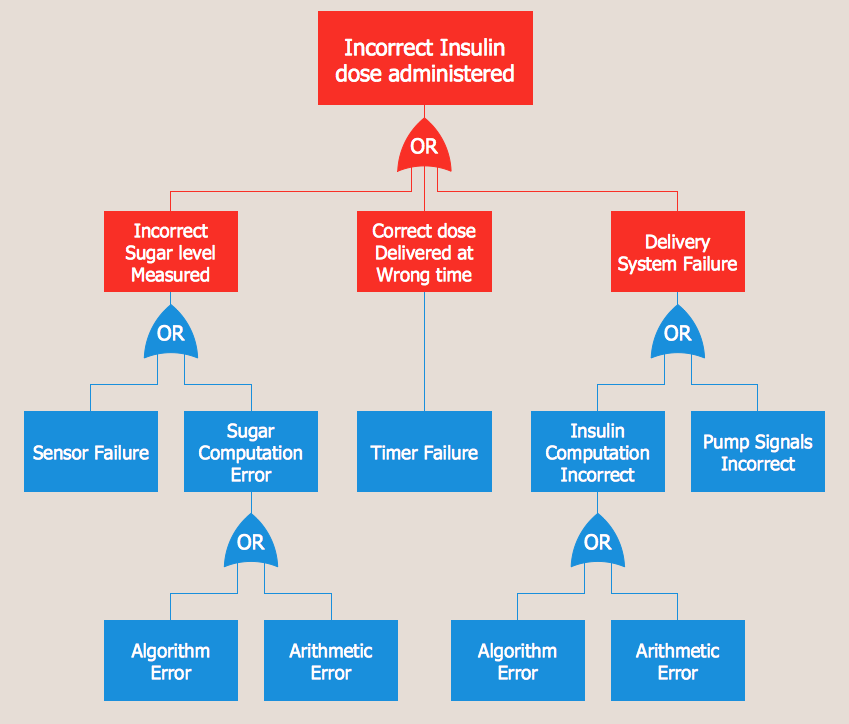
This solution extends ConceptDraw DIAGRAM.5 or later with templates, fault tree analysis example, samples and a library of vector design elements for drawing FTA diagrams (or negative analytical trees), cause and effect diagrams and fault tree diagrams.
Fault Tree Analysis Example
Process Flowchart


Context Diagram Template

This template shows the Context Diagram. It was created in ConceptDraw DIAGRAM diagramming and vector drawing software using the Block Diagrams Solution from the “Diagrams” area of ConceptDraw Solution Park.
The context diagram graphically identifies the system. external factors, and relations between them. It’s a high level view of the system. The context diagrams are widely used in software engineering and systems engineering for designing the systems that process the information.
 Seating Plans
The Seating Plans solution including samples, seating chart templates and libraries of vector design elements assists in creating the Seating plans, Seating arrangement charts, Chair layout designs, Plan drawings of cinema seating, Movie theater chair plans, extensive Cinema theater plans depicting the seating arrangement in the cinema halls, location of closet, cafe and food sale area, in designing the Seating plans for the large seating areas, Seat plan designs for airplanes, trains, etc. Use any of the included samples as the table seating chart template or seating chart template free and achieve professional drawing results in a few minutes.
Electrical Symbols, Electrical Diagram Symbols

This solution provides 26 libraries which contain 926 electrical symbols from electrical engineering: Analog and Digital Logic, Composite Assemblies, Delay Elements, Electrical Circuits, Electron Tubes, IGFET, Inductors, Integrated Circuit, Lamps, Acoustics, Readouts, Logic Gate Diagram, MOSFET, Maintenance, Power Sources, Qualifying, Resistors, Rotating Equipment, Semiconductor Diodes, Semiconductors, Stations, Switches and Relays, Terminals and Connectors, Thermo, Transformers and Windings, Transistors, Transmission Paths,VHF UHF SHF.
 CRM Center Dashboard
The CRM Center Dashboard solution extends ConceptDraw DIAGRAM functionality with CRM software tools, large collection of CRM Charts live objects, CRM icons, CRM indicators, CRM maps and navigation elements, the set of professionally designed CRM samples and templates to help you construct your own CRM Dashboards and CRM Center Dashboards in a few minutes, to depict the current and actual data by connecting or refreshing the data source file. The customer management software ConceptDraw DIAGRAM makes you free to choose the style for your dashboard and to regulate the quantity of clipart on the diagram according to your taste.
Cause and Effect Analysis - Fishbone Diagrams for Problem Solving

Pyramid Diagram and Pyramid Chart

 Seven Management and Planning Tools
Seven Management and Planning Tools solution extends ConceptDraw DIAGRAM and ConceptDraw MINDMAP with features, templates, samples and libraries of vector stencils for drawing management mind maps and diagrams.
- Fault Tree Analysis Excel Template
- Fault Tree Analysis Template Excel
- Fault Tree Analysis Template
- Fault Tree Analysis Diagrams | High Level Tree Diagram Excel
- Manufacturing 8 Ms fishbone diagram - Template | Fault Tree ...
- Fault Tree Analysis Excel
- Fault Tree Analysis Diagrams | Data structure diagram with ...
- Fault Tree Analysis Diagrams | Product Overview | Cause Mapping ...
- Fault Tree Analysis Visio Sample
- Chemical and Process Engineering | Sales Dashboard | Fault Tree ...
- ERD | Entity Relationship Diagrams, ERD Software for Mac and Win
- Flowchart | Basic Flowchart Symbols and Meaning
- Flowchart | Flowchart Design - Symbols, Shapes, Stencils and Icons
- Flowchart | Flow Chart Symbols
- Electrical | Electrical Drawing - Wiring and Circuits Schematics
- Flowchart | Common Flowchart Symbols
- Flowchart | Common Flowchart Symbols