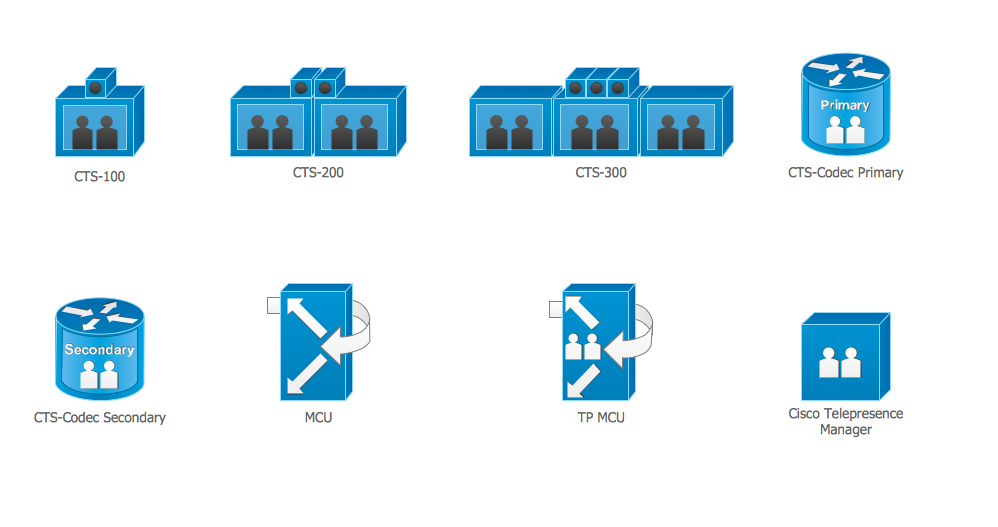
Cisco Telepresence. Cisco icons, shapes, stencils and symbols
Cisco People. Cisco icons, shapes, stencils and symbols
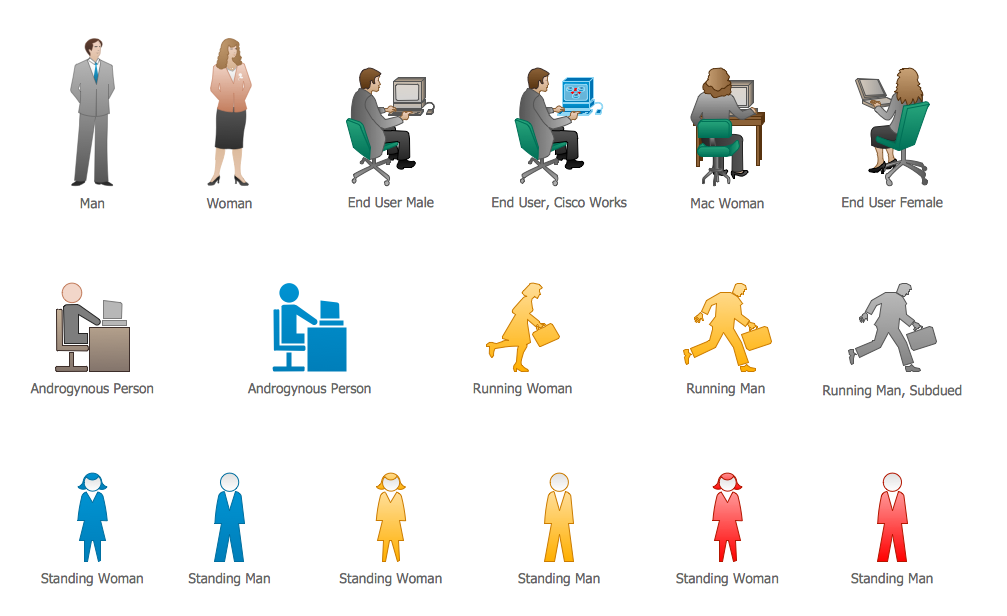
Vector stencils library "Cisco People" contains 17 pictogram symbols and clipart for drawing the computer network diagrams using the ConceptDraw DIAGRAM diagramming and vector drawing software.
Value Stream Mapping Icons
Gane Sarson Diagram

Context Diagram Template

This template shows the Context Diagram. It was created in ConceptDraw DIAGRAM diagramming and vector drawing software using the Block Diagrams Solution from the “Diagrams” area of ConceptDraw Solution Park.
The context diagram graphically identifies the system. external factors, and relations between them. It’s a high level view of the system. The context diagrams are widely used in software engineering and systems engineering for designing the systems that process the information.
Value Stream Mapping Symbols

UML Flowchart Symbols

The Rapid UML solution for ConceptDraw DIAGRAM software offers diversity of UML flowchart symbols for drawing all types of UML diagrams.
How To Create Onion Diagram

But how to create Onion Diagram? Now, it's very easy thanks to the ConceptDraw DIAGRAM diagramming and vector drawing software extended with Stakeholder Onion Diagrams Solution from the Management Area of ConceptDraw Solution Park.
Gantt Chart Software

Basic Flowchart Examples

- Electrical Symbols , Electrical Diagram Symbols | Process Flow ...
- Process Flowchart | Flowchart design. Flowchart symbols , shapes ...
- Swim Lane Diagram Template Excel
- Process Flowchart | Flowchart Software | Process Flow Diagram ...
- How to Input Data from MS Excel Into a Mind Map | Design elements ...
- Process Flowchart | Org Chart Diagram | Flow chart Example ...
- How to Input Data from MS Excel Into a Mind Map | Process ...
- Server Rack Diagram Excel Template
- PM Planning | Value Stream Mapping | Computer Network Diagrams ...
- PDPC | Fault Tree Analysis Diagrams | Process Flowchart | Free ...
- ERD | Entity Relationship Diagrams, ERD Software for Mac and Win
- Flowchart | Basic Flowchart Symbols and Meaning
- Flowchart | Flowchart Design - Symbols, Shapes, Stencils and Icons
- Flowchart | Flow Chart Symbols
- Electrical | Electrical Drawing - Wiring and Circuits Schematics
- Flowchart | Common Flowchart Symbols
- Flowchart | Common Flowchart Symbols